NCBI Bookshelf. A service of the National Library of Medicine, National Institutes of Health.
Drug shortages are a persistent problem that can cause substantial disruption in patient treatment regimens and adversely impact a patient’s health. Drug shortages can have severe consequences for patients, including high costs, delayed care, and potential medication errors or unintended side effects when using alternative or unfamiliar drugs. This report examines three drugs, asparaginase, nelarabine and heparin, used to treat life-threatening conditions and that went into shortage between 2016 and 2020. It presents trends in utilization and cost of the drugs and their alternatives before and after the shortage began. This study was based on analysis of IQVIA Medical Claims (Dx) data for 2016-2020, and the U.S. Food and Drug Administration List of Drug Shortages downloaded in March 2020. The Dx data included pre-adjudicated all-payer claims generated by office-based physicians and specialists. The report presents the trends in the total units administered and cost, as measured by service charge, for each drug. It also presents results for demographic characteristics, such as age, gender, and race/ ethnicity, and explored whether patients switched to substitute drugs during the shortage, dropped the medication, or maintained the drug with a change in the service charge. Use of the drug in shortage and its substitutes appears to depend not just on the reason of the shortage (increase in demand vs manufacturing delay), but also on the number of manufacturers and substitutes available, and the effectiveness of the alternative drug relative to the drug in shortage. The analysis also showed that the duration of these shortages can be long-lasting, with some shortages lasting almost five years. The results suggest that larger studies that include more drugs and more data are needed to better understand the underlying dynamics and characteristics of shortages and their impacts.
Key Points
- Medical product shortages are an ongoing public health concern, with at least 140 products in shortage as of July 2024.
- We use the U.S. Census Bureau’s Household Pulse Survey to examine how many adults are affected by shortages of critical medical products in the United States.
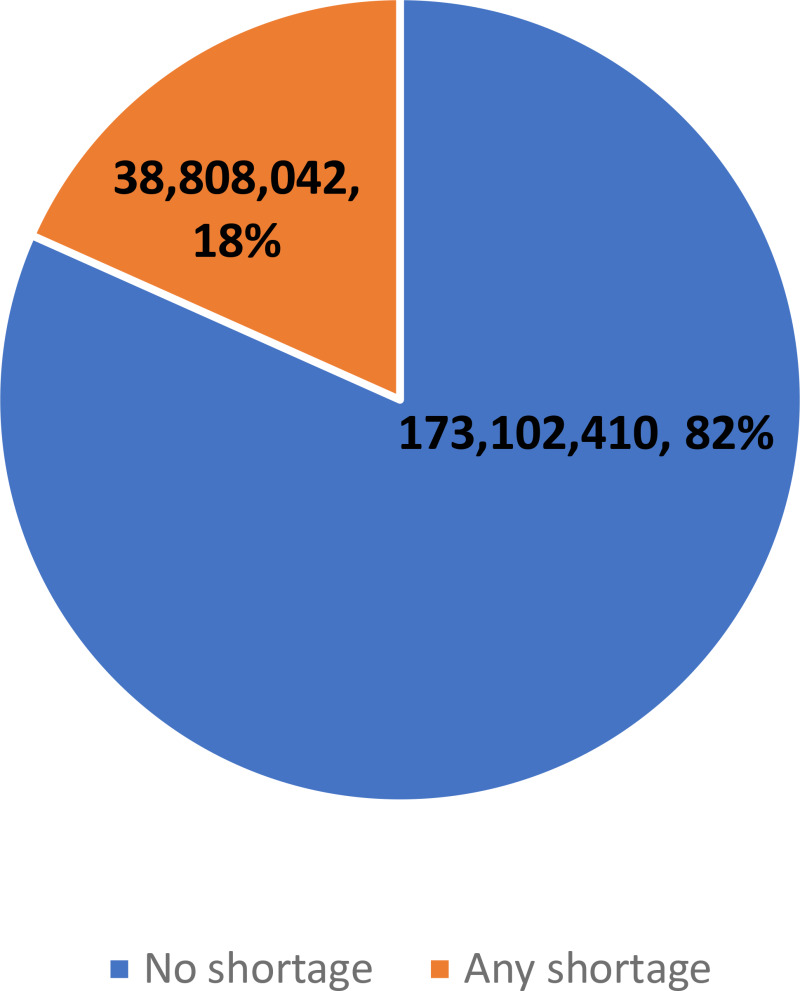
- In fall 2023, shortages of medical products impacted about 38.8 million individuals (18 percent of the adult population) in the United States; most reported being impacted by shortages of prescription and over-the-counter medications.
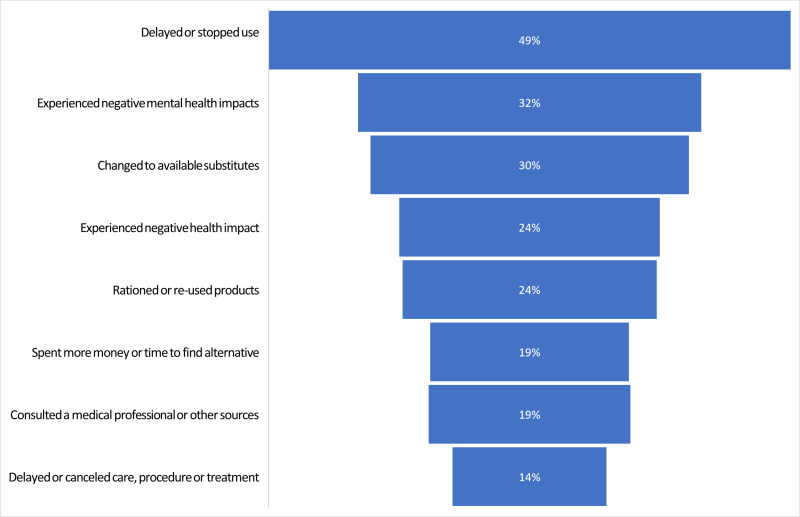
- Nearly half of those impacted by a shortage reported delaying or stopping use because a product was not available; 32 percent and 24 percent reported negative mental health effects and negative physical health effects, respectively.
- These results highlight the real-world impact of shortages on patients and the importance of identifying new strategies to prevent shortages and to mitigate the impact of shortages when they occur.
Introduction
Shortages1 of life-saving medical products, including drugs and medical devices, have been an ongoing public health concern. In a 2022 report to Congress, the U.S. Food and Drug Administration (FDA) stated that the number of drugs that entered a shortage each year had declined from a high of 250 in 2011 to 49 in 2022.2 Although the number of new drug shortages has leveled off in recent years, as of July 3, 2024, there were about 140 ongoing drug and biological product shortages.3,4 Drugs currently in shortage represent a wide range of therapeutic areas, with the most shortages in psychiatry, oncology, gastroenterology, neurology, antibiotics, and cardiovascular drugs. Shortages of medical devices have increased in recent years. Beleche et al. (2022) report that there were approximately five ongoing shortages of medical devices annually from 2010 to 2019, but this number increased fourfold in the first half of 2020 because of COVID-19-related demand increases.5 Although manufacturers are not required to notify FDA about shortages, as of July 5, 2024, FDA listed five product codes associated with ongoing shortages of medical devices, including cardiac diagnostics and monitoring products such as automated external defibrillators and oxygenator devices.6 Two of the five ongoing shortages began in 2023, and three began in 2022.
Shortages have implications for the health care systems and pharmacies that purchase, store, and dispense drugs, as well as for the patients who rely on the availability of medical products to treat and prevent disease. Health care systems must allocate resources to manage or mitigate shortages, and these costs have been estimated to be at least $359 million per year for labor resources and $200 million per year to purchase alternative treatments.7,8 Besides the costs to the health care system, patients or consumers may incur higher costs or experience other access challenges as they seek to obtain alternative treatments. These challenges may be exacerbated in times of international crisis or disaster or by other external factors.9 Patient health outcomes may also be impacted when a shortage results in abandonment of therapy, medication errors, delays, cancellations, or changes in necessary medical treatment.10,11,12,13,14,15,16,17 Shortages can also leave providers with no choice but to use second-line alternatives that may be less effective or pose additional risks compared to the first-line drug that is in shortage.
Key issues underlying medical product shortages include a broad lack of transparency, market concentration among supply chain intermediaries, and economic pressures to keep prices to levels that create insufficient incentives for redundancy or resilience-oriented manufacturing, distribution, and purchasing. These market failures lead to supply chains that are brittle, disruption-prone, and too slow to recover from shortage. Building supply chain resilience involves fostering processes that are less likely to face disruptions, as well as establishing the ability to withstand and mitigate disruptions so that their impact—when they occur—is limited. This resilience also comes from diversification of supply sources and the presence of reliable and mature manufacturing practices.
In a white paper released in April 2024, the U.S. Department of Health and Human Services (HHS) summarized the actions it has taken to address shortages to date and presented a proposal to mitigate and prevent shortages of medical products. This proposal involves the establishment of two new programs that would bring transparency into the market, link purchasing and payment decisions to supply chain resilience practices, and incentivize investments in resilience and diversification in the pharmaceutical supply chain.18, 19
Although shortages have been a persistent public health issue, there is little quantitative data about who is impacted by shortages of medical products and what actions individuals take in response to a shortage. This ASPE issue brief seeks to answer these questions using data from the U.S. Census Bureau’s Household Pulse Survey (HPS).
Data and Methods
Data
The HPS is a survey that collects data to examine how emergent issues are impacting U.S. households from a social and economic perspective. The HPS is representative at the national and state levels and for the 15 largest Metropolitan Statistical Areas (MSAs). The HPS includes U.S. adult residents’ sociodemographic information (age, sex, marital status, household income, educational attainment, insurance coverage) and geographic information (state, region, and MSA). HPS respondents are connected by text message and/or email and respond to an internet-based survey instrument. The U.S. Census Bureau, in collaboration with other federal partners and with input from the public, revises the HPS instrument on a regular basis to reflect emerging topics of interest.
The U.S. Census Bureau added two new questions in HPS Phase 3.10, fielded in three separate waves (weeks 61 to 63) from August 23, 2023, to October 30, 2023, 20 that allow us to examine the impact of medical product shortages in the United States. Specifically, the first question was, “In the past month, have you or a member of your household been directly affected by the following…?” Respondents could choose any of the following options: “Shortage of a medicine or medication that requires a prescription or is given by provider, pharmacist or hospital,” “Shortage of a medicine or medication that is sold over the counter (without a prescription),” “Shortage of a medical equipment or supplies used at home such as infusion pumps, glucose monitors, home ventilators, masks, gloves, etc.,” “Shortage of other critical products,” and/or “None.” For those who responded affirmatively to having been directly impacted by a shortage of a medical product, the survey then asked, “How did you or your household respond to the shortage?” The respondent could choose any of the following options: “Changed to available substitutes or alternatives,” “Delayed or stopped use because product was not available,” “Delayed or canceled care, procedure or treatment because product was not available,” “Rationed or re-used products,” “Spent more money or time to find substitutes or alternatives,” “Consulted a medical professional or other sources,” “Experienced negative health impacts,” “Experienced negative mental health impacts such as distress or anxiety,” “I don’t know,” and/or “Other.”
Number and Percentage of U.S. Adults Affected by a Medical Product Shortage
We combined the data from the three waves of HPS Phase 3.10 and calculated the weighted average of the number of U.S adults affected by a medical product shortage. We calculated the number of adults affected by a medical product shortage by aggregating the number of respondents who selected at least one of the options to the question, “In the past month, have you or a member of your household been directly affected by the following…?” We then calculated the percentage of adults affected by a medical product shortage as a percentage of the total population of adults in the HPS.
Modeling
We used a logit regression to examine the sociodemographic characteristics of individuals affected by a shortage of any medical product. The dependent variable was equal to one if the individual reported being affected by any type of shortage and otherwise was zero. The independent variables included categorical variables for gender, age, race/ethnicity, education, marital status, health insurance coverage, household income, presence of children in the household, and region. We used the same approach to examine the sociodemographic characteristics of individuals affected by each shortage type (prescription, over-the-counter, and medical devices).
Results
Estimated Number of Individuals Affected by a Shortage
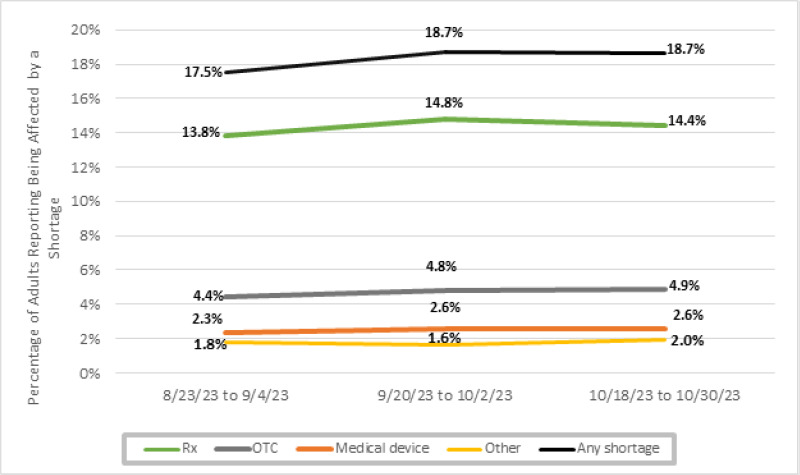
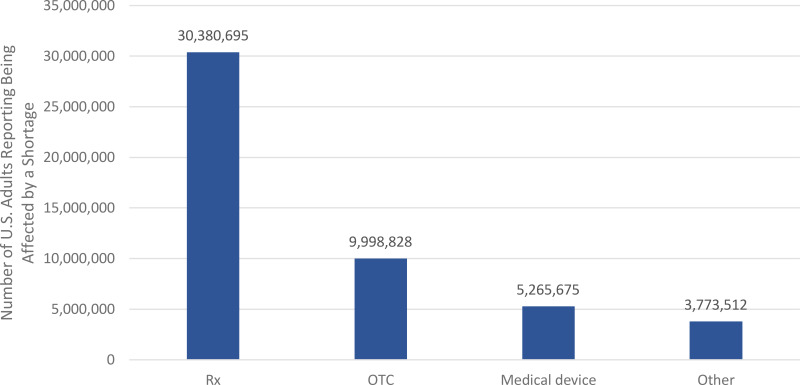
Figure 1 shows the estimated number and percentage of U.S. adults who reported being directly affected by a shortage of any medical product during August–October 2023. Across the three survey phases, an average of 18 percent of adults (approximately 38.8 million) reported being affected by a shortage of a medical product within the last month. Among those who reported being affected by any shortage, most reported being affected by a shortage of prescription medications (30.4 million, or 78 percent), followed by over-the-counter products (10 million, or 26 percent), medical devices (5.3 million, or 14 percent), and other types of shortage (3.8 million, or 10 percent) (Figure 2). In Appendix Figure 1, we show the results by survey wave, which indicate that there has been little change during the period of analysis.
Sociodemographic Characteristics of Individuals Affected by a Shortage
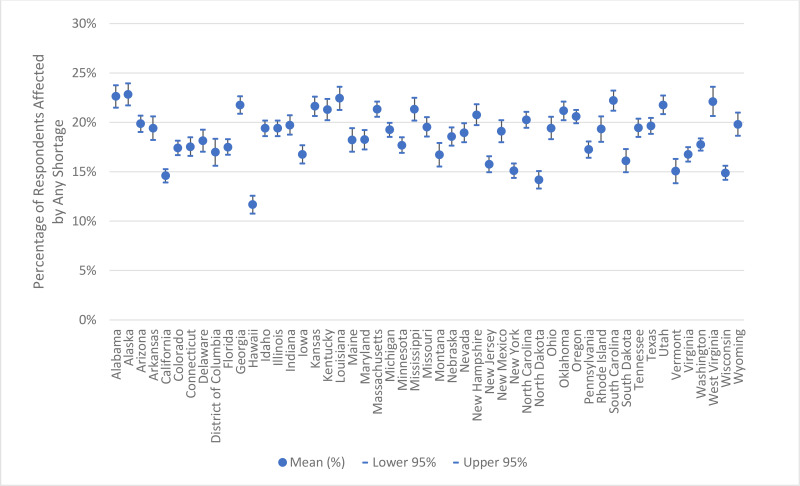
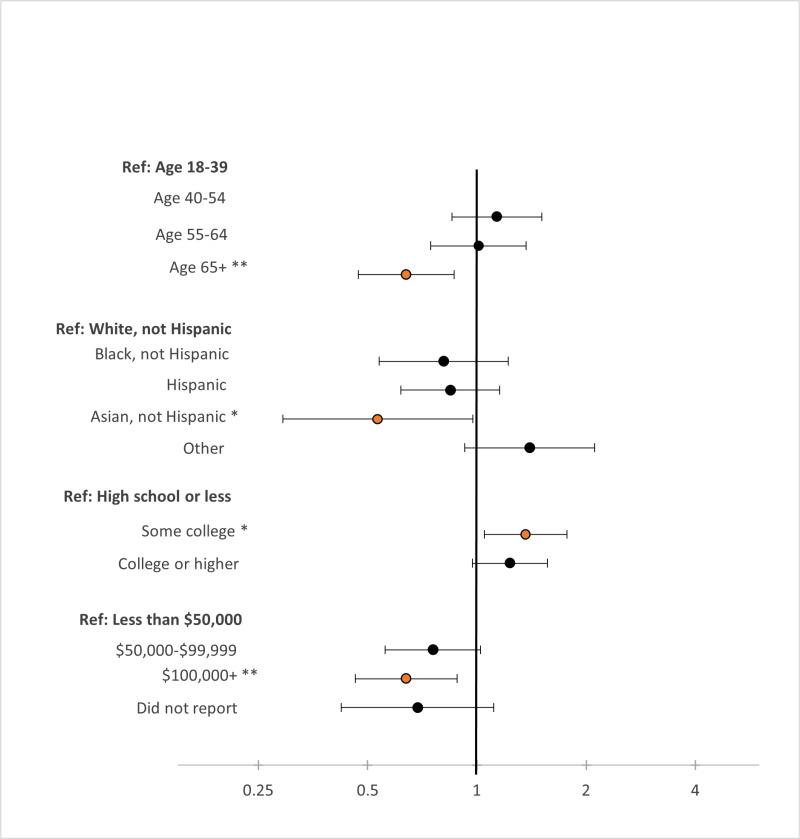
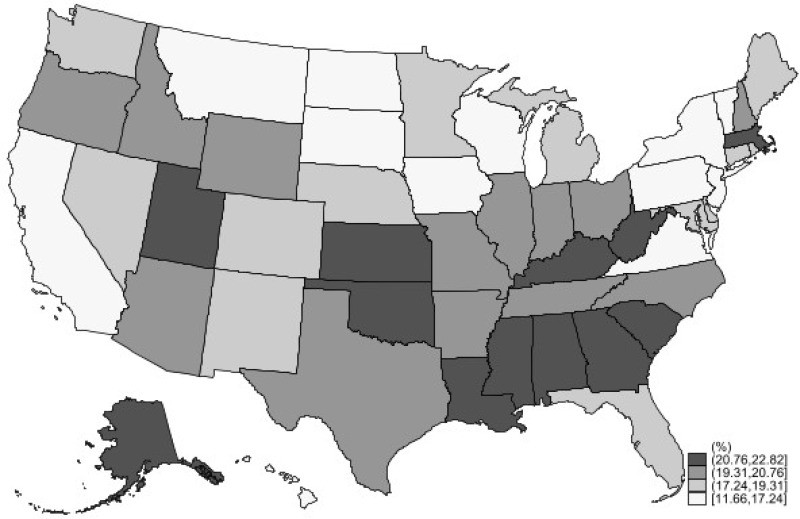
Figure 3 shows odds ratios of experiencing any shortage by key sociodemographic characteristics. These results show that the impacts of shortage vary significantly across age, race/ethnicity, income, and educational attainment. Specifically, adults aged 65 and older were less likely to have experienced a shortage in the last month relative to adults aged 18–39 (the reference group). Adults aged 40–64 were equally likely to have experienced a shortage as those aged 18–39. Non-Hispanic Asians were also less likely to have experienced a shortage compared with non-Hispanic Whites (the reference group); no significant differences were observed for other race/ethnicity categories (Hispanic and non-Hispanic Blacks). Higher household income ($100,000+) was also associated with a lower likelihood of experiencing a shortage relative to those with income of less than $50,000 (the reference group). No significant differences were observed for other household income categories ($50,000–$99,999 or “Did not report”). Conversely, adults with some college education were more likely to have experienced a shortage than those with a high school education (the reference group). No significant difference was observed for those with a college degree or higher compared to those with a high school education. Although the model did not show statistically significant differences in the percentage of people experiencing a shortage by geographical region, Figure 4 and Appendix Figure 2 show there is variation in terms of the percentage of individuals reporting being affected by a shortage within regions and across the United States (Appendix Figure 2 presents the 95 percent confidence interval for each state). Appendix Table 1 provides the demographic breakdown for those who experienced any shortage as well as for those who experienced shortages of specific product types. Appendix Table 2 shows odds ratios by specific product types; in general, the trends in sociodemographic characteristics for specific product types are similar to those shown in Figure 3 for any shortage.
Impacts of Shortages
Figure 5 presents reported impacts of shortages on health as well as how impacted individuals responded to medical product shortages. Among those affected by shortages, almost 50 percent (about 18.7 million individuals) reported delaying or stopping use of the product because the product was not available. About a quarter of individuals reported rationing or re-using their product, and 30 percent reported having to change to available substitutes. Almost 20 percent reported spending more time or money to find substitutes or alternatives. Further, 24 percent and 32 percent of respondents reported experiencing negative health impacts or negative mental health impacts, respectively.
Discussion
The COVID-19 pandemic placed an additional strain on the medical product supply chain, resulting in shortages of a diverse range of products such as infant formula, ventilators, chemotherapy drugs, and over-the-counter children’s acetaminophen. Although there is a large body of work exploring medical product shortages in terms of the types of products, numbers of shortages, root causes, potential solutions, and impacts to clinical care, relatively little research has been done on the practical impacts of these shortages on patients and whether these impacts are experienced disproportionately by certain demographic groups. A recent ASPE report examining the impact of shortages on consumer costs found that the average drug shortage affects at least a half million consumers, impacts the ability of consumers to fill their prescriptions, and leads to higher drug prices.21
As of July 3, 2024, there were more than 140 ongoing shortages of medical products (131 drugs, 11 biological products, and 5 medical devices). The analysis presented in this issue brief shows that shortages impacted approximately 18 percent of American adults in the fall of 2023. Among those impacted by shortages, the majority experienced shortages of prescription drugs or over-the-counter products. Shortages of medical devices were less commonly reported. Although a recent publication showed an increase in medical device shortages during the COVID-19 pandemic, 22 the majority of these products would not be captured under the survey analyzed here (HPS 3.10), which focused specifically on home equipment or supplies (rather than hospital-based equipment such as ventilators). Our results demonstrate that the impacts of these shortages were not felt evenly across demographic groups or across the United States.
The HPS data also demonstrate the significant impact of shortages on clinical care. Nearly half of respondents reported delaying or stopping care due to a medical product shortage, and 24 percent of respondents reported negative physical impacts. Furthermore, 32 percent of HPS respondents reported negative impacts to their mental health. Together, these results highlight that shortages have serious impacts on patients’ lives and well-being even beyond their immediate impact on clinical care.
This study is the first to present national-level estimates on the percentage of Americans affected by shortages and revealed findings that may seem surprising. For example, the results indicate that almost two in every 10 adults have experienced a shortage of a medical product, and that adults aged 65 and older were less likely to have experienced a shortage relative to adults aged 18–39. Most past studies have used data that are not generalizable or have used different data or definitions of shortages, which makes comparison with this ASPE study difficult. A recent American Cancer Society (ACS) survey of 1,222 cancer patients and survivors fielded from September 12 to 25, 2023, showed that 10 percent of survey respondents who had been in active treatment for the 12 months preceding the survey had been impacted by shortages.23 This ACS survey revealed that Medicaid enrollees were most impacted by shortages (22 percent), followed by cancer patients covered by Medicare (9 percent) or employer-provided plans (9 percent). The ACS survey also showed that nearly half of the cancer patients surveyed reported delaying or missing treatment (45 percent). Although the sample size is smaller and the population examined is different, these findings are consistent with our results. Another study that examined the percentage reduction in the number of consumers filling prescriptions after a shortage revealed that although adults aged 65–85 represented almost a third of all prescriptions fills, adults aged 45–54 saw the largest impact in terms of the percentage reduction in the number of prescriptions following a shortage.24 Further, a separate study revealed that age groups impacted by shortages varied by the type of drug in shortage and the underlying condition that the drug was treating. That study showed that shortages of pediatric drugs were most likely to impact patients 18 and younger, while a shortage of heparin, used to treat cardiovascular disease, was most likely to impact older adults.25 These findings show the importance of including medical condition or comorbidities to further understand the impacts of shortages.
Limitations
The HPS is administered to a sample of over a million individuals, and the response rate ranged between 6.5 percent and 7.5 percent over the period of analysis for this study.26 Compared to other surveys, such as the National Health Survey (60 percent response rate in 2019) or the American Community Survey (84.4 percent response rate in 2022), this response rate is considered low and may impact the representativeness of the sample.27,28 Although the HPS is designed to be representative at the national and state levels and for the 15 largest MSAs, the sample of individuals responding to the survey questions may not be representative of the U.S. population for multiple reasons. First, the survey is administered online, which may limit participation to respondents who are more active online, or may discourage participation among those with limited internet access or knowledge. Further, it is also possible that those who responded to the survey may be different from those that did not respond. Thus, our estimates should be used with caution when attempting to generalize beyond the factors examined herein. A full discussion of limitations associated with the HPS can be found in the survey’s technical documentation.29
Although we discuss these results in the context of the FDA definition of shortages, consumers may experience shortages that do not meet this definition. These could include short-term or local shortages due to distribution issues, pharmacy stocking decisions, etc. As a result, these results likely overestimate the percentage of the population experiencing a medical product shortage as defined by FDA.
Our results show variation in the population experiencing medical product shortages; however, we do not have a baseline comparison group to use in evaluating whether some demographic groups may use medical products at different rates or to control for existing comorbidities. For example, we might expect older adults to use medical products at a higher rate than younger adults for certain conditions but not others. Therefore, the demographic group comparisons should be interpreted with this potential bias in mind.
Conclusions
Although efforts have been made to address medical product shortages, they continue to be a major public health concern. Our results show that shortages of medical products—including prescription drugs, over-the-counter drugs, and medical devices—impacted approximately 18 percent of U.S. adults in fall 2023. These shortages had significant impacts on patient care, patients’ mental and physical health, and costs to patients. Together, these results highlight the real-world impact of shortages on patients and the importance of identifying new strategies to prevent shortages and mitigate the impact of shortages when they occur.
Appendix
Appendix Figure 1Percentage of U.S. Adults Reporting Being Affected by Medical Product Shortages, by Wave of the Household Pulse Survey
Notes: We define “any shortage” as a respondent who reported being impacted by at least one type of shortage (prescription, over-the-counter, device, other). In calculating “any shortage,” respondents experiencing multiple shortages are only counted once; therefore, the percentages of respondents experiencing shortages of each of the different product types do not add up to the total experiencing any shortage. “Rx” denotes shortage of a medicine or medication that requires a prescription or is given by a provider, pharmacist, or hospital. “OTC” denotes shortage of a medicine or medication that is sold over the counter (without a prescription). “Medical device” denotes shortage of a medical equipment or supplies used at home such as infusion pumps, glucose monitors, home ventilators, masks, gloves, etc. “Other” includes shortages of other critical products.
Source: ASPE analysis of the Household Pulse Survey for August–October 2023.
Appendix Figure 2Percentage of U.S. Adults Reporting Being Affected by Medical Product Shortages, by State and the District of Columbia
Notes: We define “any shortage” as a respondent who reported being impacted by at least one type of shortage (prescription, over-the-counter, device, other). In calculating “any shortage,” respondents experiencing multiple shortages are only counted once. The mean represents the average percentage of respondents experiencing any shortage within the last month across the three survey waves administered during August–October 2023 in each state.
Source: ASPE analysis of the Household Pulse Survey for August–October 2023.
Appendix Table 1Select Sociodemographic Characteristics of U.S. Adults Reporting Being Affected by a Medical Product Shortage
| Demographic Characteristic | Any | Rx | OTC | Medical Device | Other | |
|---|---|---|---|---|---|---|
| Sex | Male | 45% | 46% | 42% | 51% | 48% |
| Female | 55% | 54% | 58% | 49% | 52% | |
| Age | 18–24 | 7% | 8% | 6% | 8% | 7% |
| 25–39 | 29% | 30% | 27% | 28% | 28% | |
| 40–54 | 29% | 30% | 29% | 30% | 30% | |
| 55–64 | 18% | 18% | 20% | 17% | 19% | |
| 65+ | 16% | 14% | 17% | 16% | 17% | |
| Did not report | 0% | 0% | 0% | 0% | 0% | |
| Race/Ethnicity | White, not Hispanic | 64% | 66% | 60% | 50% | 49% |
| Black, not Hispanic | 11% | 10% | 11% | 16% | 14% | |
| Hispanic | 16% | 15% | 18% | 22% | 26% | |
| Asian, not Hispanic | 3% | 3% | 4% | 4% | 3% | |
| Other | 6% | 6% | 7% | 8% | 8% | |
| Education | High school or less | 33% | 30% | 37% | 42% | 47% |
| Some college | 34% | 35% | 36% | 34% | 30% | |
| College or higher | 33% | 35% | 28% | 24% | 23% | |
| Marital Status | Now married | 54% | 56% | 52% | 48% | 45% |
| Widowed, separated, or divorced | 20% | 18% | 24% | 24% | 27% | |
| Never married | 25% | 26% | 23% | 28% | 26% | |
| Did not report | 0% | 0% | 0% | 0% | 1% | |
| Insurance Coverage | Private | 44% | 48% | 35% | 31% | 28% |
| Medicare | 11% | 11% | 12% | 12% | 10% | |
| Medicaid | 17% | 16% | 22% | 23% | 21% | |
| Other | 11% | 10% | 13% | 12% | 14% | |
| Uninsured | 7% | 7% | 10% | 10% | 11% | |
| Did not report | 9% | 8% | 9% | 12% | 15% | |
| Household Income | Less than $50,000 | 36% | 33% | 44% | 48% | 47% |
| $50,000–$99,999 | 26% | 27% | 25% | 22% | 20% | |
| $100,000+ | 25% | 28% | 19% | 16% | 14% | |
| Did not report | 13% | 12% | 12% | 14% | 19% | |
| Any Children in the Household? | No | 58% | 59% | 54% | 56% | 52% |
| Yes | 42% | 41% | 46% | 44% | 48% | |
| Region | Northeast | 16% | 15% | 16% | 14% | 18% |
| South | 41% | 42% | 40% | 42% | 40% | |
| Midwest | 21% | 21% | 20% | 18% | 20% | |
| West | 22% | 21% | 24% | 25% | 22% | |
| Observations | Unweighted | 34,826 | 27,819 | 8,825 | 3,893 | 18% |
| Weighted | 38,808,042 | 30,380,695 | 9,998,828 | 5,265,675 | 3,773,512 | |
Notes: We define “any shortage” as a respondent who reported being impacted by at least one type of shortage (prescription, over-the-counter, device, other). “Rx” denotes shortage of a medicine or medication that requires a prescription or is given by a provider, pharmacist, or hospital. “OTC” denotes shortage of a medicine or medication that is sold over the counter (without a prescription). “Medical device” denotes shortage of a medical equipment or supplies used at home such as infusion pumps, glucose monitors, home ventilators, masks, gloves, etc. “Other” includes shortages of other critical products.
Source: ASPE analysis of the Household Pulse Survey for August–October 2023.
Appendix Table 2Odd Ratios: Factors Associated with Reporting Experiencing a Medical Product Shortage, by Type of Product
| Demographic Characteristic | Odds Ratio | |||||
|---|---|---|---|---|---|---|
| Any | Rx | OTC | Device | Other | ||
| Sex | Male | 0.89 | 0.90 | 0.84 | 1.23 | 1.11 |
| Female | Ref | Ref | Ref | Ref | Ref | |
| Age | 18–39 | Ref | Ref | Ref | Ref | Ref |
| 40–54 | 1.13 | 1.15 | 1.30 | 1.24 | 1.25 | |
| 55–64 | 1.01 | 0.96 | 1.35 | 1.02 | 1.19 | |
| 65+ | 0.64** | 0.58** | 0.92 | 0.75 | 0.88 | |
| Race/Ethnicity | White, not Hispanic | Ref | Ref | Ref | Ref | Ref |
| Black, not Hispanic | 0.81 | 0.75 | 0.84 | 1.49 | 1.28 | |
| Hispanic | 0.85 | 0.75 | 0.98 | 1.29 | 1.63 | |
| Asian, not Hispanic | 0.53* | 0.49* | 0.85 | 0.99 | 0.80 | |
| Other | 1.40 | 1.31 | 1.66 | 2.18 | 2.17 | |
| Education | High school or less | Ref | Ref | Ref | Ref | Ref |
| Some college | 1.36* | 1.47* | 1.34 | 1.18 | 0.96 | |
| College or higher | 1.23 | 1.36* | 1.10 | 0.97 | 0.87 | |
| Marital Status | Now married | Ref | Ref | Ref | Ref | Ref |
| Widowed, separated, or divorced | 1.10 | 1.01 | 1.15 | 1.22 | 1.47 | |
| Never married | 0.98 | 0.99 | 0.94 | 0.99 | 1.06 | |
| Did not report | 1.09 | 0.47 | 0.59 | 0.76 | 1.68 | |
| Insurance Coverage | Insured | Ref | Ref | Ref | Ref | Ref |
| Uninsured | 1.23 | 1.22 | 1.49 | 1.36 | 1.56 | |
| Did not report | 1.32 | 1.17 | 1.18 | 1.54 | 1.47 | |
| Household Income | Less than $50,000 | Ref | Ref | Ref | Ref | Ref |
| $50,000–$99,999 | 0.76 | 0.87 | 0.66 | 0.55 | 0.55 | |
| $100,000+ | 0.64** | 0.75 | 0.45** | 0.37* | 0.40* | |
| Did not report | 0.69 | 0.72 | 0.61 | 0.54 | 0.82 | |
| Any Children in Household? | No | Ref | Ref | Ref | Ref | Ref |
| Yes | 1.22 | 1.15 | 1.50 | 1.24 | 1.49 | |
| Region | Northeast | Ref | Ref | Ref | Ref | Ref |
| South | 1.14 | 1.23 | 1.00 | 1.14 | 0.86 | |
| Midwest | 1.07 | 1.11 | 0.96 | 1.02 | 0.90 | |
| West | 0.98 | 0.97 | 0.98 | 1.16 | 0.78 | |
Notes: We define “any shortage” as a respondent who reported being impacted by at least one type of shortage (prescription, over-the-counter, device, other). “Rx” denotes shortage of a medicine or medication that requires a prescription or is given by a provider, pharmacist, or hospital. “OTC” denotes shortage of a medicine or medication that is sold over the counter (without a prescription). “Device” denotes shortage of a medical equipment or supplies used at home such as infusion pumps, glucose monitors, home ventilators, masks, gloves, etc. “Other” includes shortages of other critical products.
- **
p < 0.01
- *
p < 0.05.
Constant is not reported but is included in the logit model.
Source: ASPE analysis of the Household Pulse Survey for August–October 2023.
Footnotes
- 1
FDA considers a drug to be in shortage when the total supply of all versions of a commercially available product cannot meet the current demand, and a registered alternative manufacturer will not meet the current and/or projected demands for the potentially medically necessary use(s) at the patient level. Although alternative definitions and data sources exist, this issue brief will use the FDA definition and data when referring to shortages.
- 2
U.S. Food and Drug Administration. (2022). Report to Congress: Drug shortages CY 2022. https://www
.fda.gov/media /169302/download?attachment - 3
U.S. Food and Drug Administration. (n.d.). FDA drug shortages: Current and resolved drug shortages and discontinuations reported to FDA. Retrieved July 5, 2024, from https://www
.accessdata .fda.gov/scripts/drugshortages /default.cfm - 4
U.S. Food and Drug Administration. (n.d.). CBER-regulated products: Current shortages. Retrieved July 5, 2024, from https://www
.fda.gov/vaccines-blood-biologics /safety-availability-biologics /cber-regulated-products-current-shortages - 5
Beleche, T., Kuecken, M., Sassi, A., Toran, K., Galloway, E., & Henry, T. (2022). Characteristics of medical device shortages in the US, 2006–20. Health Affairs, 41(12), 1790–1794. https://doi
.org/10.1377/hlthaff .2022.00643 - 6
U.S. Food and Drug Administration. (n.d.). Medical device shortages list. Retrieved July 5, 2024, from https://www
.fda.gov/medical-devices /medical-device-supply-chain-and-shortages /medical-device-shortages-list#shortage - 7
Vizient Inc. (2019). Drug shortages and labor costs: Measuring the hidden costs of drug shortages on U.S. hospitals. https:
//wieck-vizient-production .s3.us-west-1 .amazonaws.com/page-Brum /attachment /c9dba646f40b9b5def8032480ea51e1e85194129 - 8
FiercePharma. (2011). Drug shortages cost U.S. care providers at least $200 million annually, pose patient safety risks, research suggests. https://www
.fiercepharma .com/pharma/drug-shortages-cost-u-s-care-providers-at-least-200-million-annually-pose-patient-safety - 9
Office of the Assistant Secretary for Planning and Evaluation, U.S. Department of Health and Human Services. (2023). ASPE report to Congress: Impact of drug shortages on consumer costs. https://aspe
.hhs.gov /reports/drugshortages-impacts-consumer-costs - 10
McLaughlin, M., Kotis, D., Thomson, K., Harrison, M., Fennessy, G., Postelnick, M., & Scheetz, M. H. (2013). Effects on patient care caused by drug shortages: A survey. Journal of Managed Care Pharmacy, 19(9), 783–788. https://doi
.org/10.18553/jmcp .2013.19.9.783 - 11
Goldsack, J. C., Reilly, C., Bush, C., McElligott, S., Bristol, M. N., Motanya, U. N., Field, R., Vozniak, J. M., Wong, Y.-N., Schwartz, J. S., & Domchek, S. (2014). Impact of shortages of injectable oncology drugs on patient care. American Journal of Health-System Pharmacy, 71(7), 571–578. https://doi
.org/10.2146/ajhp130569 - 12
Tucker, E. L., Cao, Y., Fox, E. R., & Sweet, B. V. (2020). The drug shortage era: A scoping review of the literature 2001–2019. Clinical Pharmacology & Therapeutics, 108(6), 1150–1155. https://doi
.org/10.1002/cpt.1934 - 13
Phuong, J. M., Penm, J., Chaar, B., Oldfield, L. D., & Moles, R. (2019). The impacts of medication shortages on patient outcomes: A scoping review. PLoS ONE, 14(5), e0215837. https://doi
.org/10.1371/journal .pone.0215837 - 14
Hantel, A., Siegler, M., Hlubocky, F., Colgan, K., & Daugherty, C. K. (2019). Prevalence and severity of rationing during drug shortages: A national survey of health system pharmacists. JAMA Internal Medicine, 179(5), 710. https://doi
.org/10.1001/jamainternmed .2018.8251 - 15
Bykov, K., Gagne, J. J., Wang, B., & Choudhry, N. K. (2018). Impact of a metoprolol extended release shortage on post-myocardial infarction β-blocker utilization, adherence, and rehospitalization. Circulation: Cardiovascular Quality and Outcomes, 11(10), e004096. https://doi
.org/10.1161/CIRCOUTCOMES .117.004096 - 16
Vail, E., Gershengorn, H. B., Hua, M., Walkey, A. J., Rubenfeld, G., & Wunsch, H. (2017). Association between US norepinephrine shortage and mortality among patients with septic shock. JAMA, 317(14), 1433–1442. https://doi
.org/10.1001/jama.2017.2841 - 17
Metzger, M. L., Billett, A., & Link, M. P. (2012). The impact of drug shortages on children with cancer—The example of mechlorethamine. New England Journal of Medicine, 367(26), 2461–2463. https://doi
.org/10.1056/NEJMp1212468 - 18
Department of Health and Human Services. (2024). Policy considerations to prevent drug shortages and mitigate supply chain vulnerabilities in the United States. https://aspe
.hhs.gov /reports/preventing-shortages-supply-chainvulnerabilities - 19
In May 2024, the U.S. Senate Committee on Finance released a proposal that would establish a new program for hospitals and physicians to incentivize transparent, reliable, and resilient purchasing practices across the supply chain through Medicare payments. https://www
.finance.senate .gov/chairmans-news /wyden-and-crapo-release-draft-legislation-to-combat-prescription-drug-shortages - 20
Specifically, week 61 fielded from August 23, 2023, to September 4, 2023; week 62 fielded from September 20, 2023, to October 2, 2023; and week 63 fielded from October 18, 2023, to October 30, 2023.
- 21
Office of the Assistant Secretary for Planning and Evaluation, U.S. Department of Health and Human Services, 2023.
- 22
Beleche, Kuecken, Sassi, Toran, Galloway, & Henry, 2022.
- 23
American Cancer Society Cancer Action Network. (2023). Survivor views: Drug shortages, telehealth, & biomarker testing. https://www
.fightcancer .org/sites/default /files/national_documents /survey_drug_shortages _biomarkers_1.pdf - 24
Office of the Assistant Secretary for Planning and Evaluation, U.S. Department of Health and Human Services, 2023.
- 25
Office of the Assistant Secretary for Planning and Evaluation & NORC at the University of Chicago. (2024). Impact of drug shortages on patients in the United States: A case study of three drugs. U.S. Department of Health and Human Services. https://aspe
.hhs.gov /reports/shortages-three-drugs - 26
For Week 61 (August 23–September 4, 2023), the Census Bureau sent invitations to 1,053,486 households and received a total of 68,454 responses, for a response rate of 6.5 percent. For Week 63 (October 18–30, 2023), the Census Bureau sent invitations to 1,054,612 households and received a total of 79,371 responses, for a response rate of 7.5 percent. See: U.S. Census Bureau. (2023). Source of the data and accuracy of the estimates for the Household Pulse Survey—Phase 3.10. https://www2
.census.gov /programs-surveys /demo/technical-documentation /hhp/Phase3–10 _Source_and_Accuracy_Week63 .pdf - 27
National Center for Health Statistics, Centers for Disease Control and Prevention. (2023, June 26). Health, United States, 2020–2021: National Health Interview Survey (NHIS). https://www
.cdc.gov/nchs /hus/sourcesdefinitions/nhis.htm - 28
U.S. Census Bureau. (n.d.). Response rates and reasons for noninterviews (in percent)—Housing units [Data set]. https://www
.census.gov /acs/www/methodology /sample-size-and-data-quality /response-rates/ - 29
Peterson, S., Toribio, N., Farber, J., & Hornick, D. (2021). Nonresponse Bias Report for the 2020 Household Pulse Survey. U.S. Census Bureau. https://www2
.census.gov /programs-surveys /demo/technical-documentation /hhp/2020_HPS _NR_Bias_Report-final.pdf
Figures
Figure 1Estimated Number and Percentage of U.S. Adults Reporting Being Directly Affected by a Medical Product Shortage
Notes: We define “any shortage” as a respondent who reported being impacted by at least one type of shortage (prescription, over-the-counter, device, other). In calculating “any shortage,” respondents experiencing multiple shortages are only counted once. The “any shortage” number represents the average number of respondents experiencing any shortage within the last month across the three survey waves administered during August-October 2023.
Source: ASPE analysis of the Household Pulse Survey for August–October 2023.
Figure 2Estimated Number of U.S. Adults Reporting Being Affected by Shortages, by Type of Medical Product
Notes: We define “any shortage” as a respondent who reported being impacted by at least one type of shortage (prescription, over-the-counter, device, other). In calculating “any shortage,” respondents experiencing multiple shortages are only counted once; therefore, the numbers of respondents experiencing shortages of each product type do not add up to the total experiencing any shortage. “Rx” denotes shortage of a medicine or medication that requires a prescription or is given by a provider, pharmacist, or hospital. “OTC” denotes shortage of a medicine or medication that is sold over the counter (without a prescription). “Medical device” denotes shortage of a medical equipment or supplies used at home such as infusion pumps, glucose monitors, home ventilators, masks, gloves, etc. “Other” includes shortages of other critical products. Numbers represent the average number of respondents experiencing “any shortage” within the last month across the three survey waves administered during August-October 2023.
Source: ASPE analysis of the Household Pulse Survey for August–October 2023.
Figure 3Odds Ratios: Factors Associated with Reporting Experiencing Any Medical Product Shortage
Notes: We define “any shortage” as a respondent who reported being impacted by at least one type of shortage (prescription, over-the-counter, device, other). In calculating “any shortage,” respondents experiencing multiple shortages are only counted once. “Rx” denotes shortage of a medicine or medication that requires a prescription or is given by a provider, pharmacist, or hospital. “OTC” denotes shortage of a medicine or medication that is sold over the counter (without a prescription). “Medical device” denotes shortage of a medical equipment or supplies used at home such as infusion pumps, glucose monitors, home ventilators, masks, gloves, etc. “Other” includes shortages of other critical products. ** p < 0.01; * p < 0.05.
Source: ASPE analysis of the Household Pulse Survey for August–October 2023.
Figure 4Percentage of Individuals Affected by Any Medical Product Shortage, by State
Notes: We define “any shortage” as a respondent who reported being impacted by at least one type of shortage (prescription, over-the-counter, device, other). In calculating “any shortage,” respondents experiencing multiple shortages are only counted once.
Source: ASPE analysis of the Household Pulse Survey for August–October 2023.
Trini Beleche is a Senior Economist in the Office of Science and Data Policy at ASPE.
Allison Kolbe is a Social Science Analyst in the Office of Science and Data Policy at ASPE.
Suggested citation:
Beleche, T., and Kolbe, A. Medical Product Shortages in the United States: Demographic and Geographic Factors and Impacts. Washington, D.C.: Office of the Assistant Secretary for Planning and Evaluation, U.S. Department of Health and Human Services. July 2024.All material appearing in this report is in the public domain and may be reproduced or copied without permission; citation as to source, however, is appreciated.
Links and references to information from non-governmental organizations are provided for informational purposes and are not HHS endorsements, recommendations, or preferences for the non-governmental organizations.

