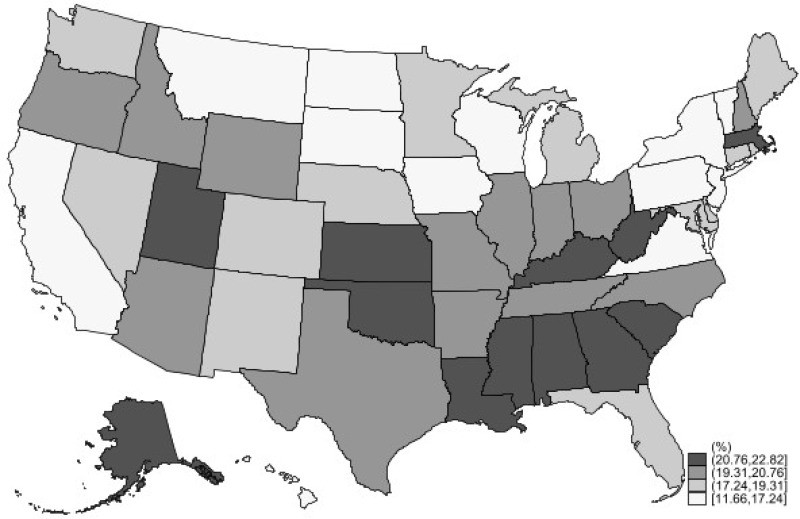
Figure 4 is a map of the United States showing the percentage of individuals affected by medical product shortages by state. The percentage of impacted adults by state ranges from ten percent to twenty-five percent, with states in the South generally having a higher percentage of adults affected by medical product shortages than states in other regions.

Figure 4Percentage of Individuals Affected by Any Medical Product Shortage, by State

Notes: We define “any shortage” as a respondent who reported being impacted by at least one type of shortage (prescription, over-the-counter, device, other). In calculating “any shortage,” respondents experiencing multiple shortages are only counted once.

Source: ASPE analysis of the Household Pulse Survey for August–October 2023.

From: Medical Product Shortages in the United States: Demographic and Geographic Factors and Impacts

Cover of Medical Product Shortages in the United States: Demographic and Geographic Factors and Impacts
Medical Product Shortages in the United States: Demographic and Geographic Factors and Impacts: Issue Brief [Internet].
Beleche T, Kolbe A.

NCBI Bookshelf. A service of the National Library of Medicine, National Institutes of Health.