SUMMARY
Pentraxin 3 (PTX3), a long pentraxin, is not only released from dendritic cells and neutrophils but also from epithelial and endothelial cells such as alveolar epithelium. Severe acute respiratory syndrome coronavirus-2 (SARS-CoV-2) initially activates the innate immune system, causing a complex immune response. Clinical and experimental studies suggest that PTX3, a locally and systemically secreted marker, can be used as a predictor of the severity and mortality in respiratory infections. In the current study, serum PTX3 levels in patients hospitalized with COVID-19 were found to be significantly increased at admission and showed significant association with the disease severity.
Key words: COVID-19, Pentraxin 3, Innate immunity, C-reactive protein, SARS-CoV-2
Introduction
As with all viruses, severe acute respiratory syndrome coronavirus-2 (SARS-CoV-2) initially activates the innate immune system, causing a complex immune response (1). Once the virus has entered the body, viral components are recognized by the pattern recognition receptors (PRR) to be destroyed by the immune system (2). On the other hand, proinflammatory cytokines such as interleukins (IL) 1 and 6, and tumor necrosis factor-α increase, inducing production of many inflammatory molecules, among which are pentraxins, involved in tissue repair and remodeling (3).
Pentraxins are soluble PRRs with long and short types. C-reactive protein (CRP) is the best known short type most commonly used in clinical practice. Pentraxin 3 (PTX3), a long pentraxin, is not only released from dendritic cells and neutrophils but also from epithelial and endothelial cells such as alveolar epithelium. Research has shown that PTX3 has a regulatory role in many conditions such as fungal, bacterial and viral infections, severe inflammatory response syndrome, sepsis, cardiovascular disease, and acute respiratory distress syndrome (ARDS) (4, 5). Different methods can be used to show the severity of COVID-19. In a study, red cell distribution width, mean platelet volume and platelet volume index were found to offer an inexpensive and effective method to predict the severity of the disease (6). In addition, the oxygenation index in COVID-19 does not correlate with disease severity as in typical ARDS (7).
Given that PTX3 reaches peak levels within 6-8 hours, as compared with 24-48 hours for CRP, it can respond faster than CRP and reaches peak levels within 6-8 hours, which may be significant in prognosis (8). PTX3 could prove to be a significant and useful prognostic marker for COVID-19 (9, 10). This study aimed to determine admission PTX3 levels in patients hospitalized with COVID-19.
Patients and Methods
Study design and patients
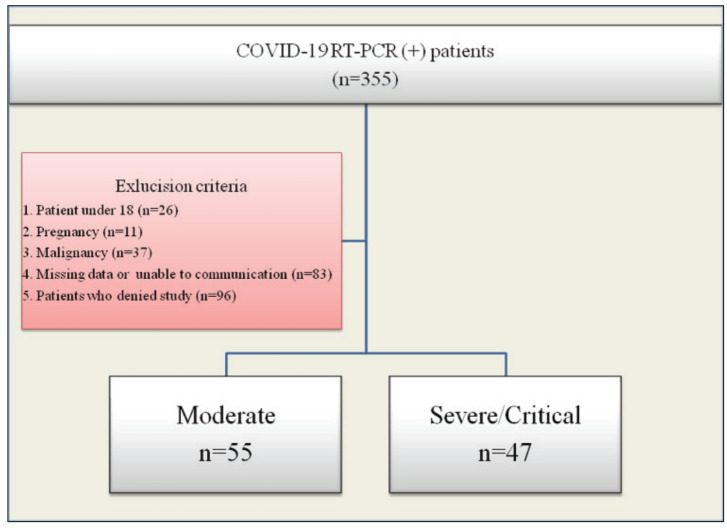
This observational, cross-sectional study evaluated 355 consecutive patients who were hospitalized with the diagnosis COVID-19 between June and August 2020. Hospitalization criteria included body temperature ≥37.8 C°, respiratory rate ≥16 breaths/min, oxygen saturation <93%, clinical signs of respiratory failure, widespread pulmonary involvement on computed tomography with or without a reverse transcription polymerase chain reaction (RT-PCR) positive test for SARS-CoV-2. Inclusion and exclusion criteria are presented in the CONSORT flow diagram (Fig. 1). Final analysis included 102 eligible patients, 63 (61.8%) of them male, median age 55 (range 42-63) years. Comorbidities were recorded. Approval for the study was obtained from the local Ethics Committee on May 21, 2020.
Fig. 1.
Flow diagram of exclusion and inclusion criteria.
Disease was classified as moderate, severe or critical, according to the World Health Organization case management guideline (11). SARS-CoV-2 positivity was based on nasopharyngeal swab RT-PCR testing (BioEksen, COVID-19 Plus RealAmp Kit, Turkey). Venous blood samples were collected by venipuncture and processed within 2 hours of blood collection. Serum levels of alanine transaminase (ALT), aspartate transaminase (AST), total protein, albumin, total bilirubin, ferritin, D-dimer, troponin I, procalcitonin (PCT) and CRP were determined using a Beckman Coulter AU5800 clinical chemistry analyzer (Beckman Coulter, Brea, CA, USA). Complete blood count was analyzed on an ADVIA 2120i hematology autoanalyzer (Siemens Healthcare Diagnostics, Erlangen, Germany). For coagulation assay (fibrinogen), blood samples were collected into 0.105 mmol/L trisodium citrate-containing test tubes. The samples were centrifuged at 2000 g for 15 minutes. All procedures were carried out on a random access coagulation analyzer (Beijing Succeeder Technology Inc., China), and the reagents were used according to the manufacturer’s protocol.
In addition to the routine hemogram and biochemical tests at the time of admission, blood samples were collected from the patients who gave their consent for PTX3 testing. Computed tomography and blood gases were routinely obtained. Microbiological tests were performed for secondary bacterial infections.
For PTX3 measurements, venous blood samples were centrifuged and EDTA plasma was stored at -80 °C until use with the sandwich ELISA technique (Abbkine, Inc., China), where an antibody specific to PTX3 is pre-coated on the microplate. Standards and samples are pipetted into the wells where any PTX3 molecule present binds to the immobilized antibody. After removal of unbound materials, PTX3, a biotin-conjugated antibody, is placed into specific wells. After washing, streptavidin-conjugated horseradish peroxidase is added to the wells. After removal of any unbound avidin-enzyme reagent with washing, a substrate solution is added to the wells, and the color develops in proportion to the amount of bound PTX3 in the initial step. Once the color development has been completed, the intensity of the color is measured by the analyzer.
Statistical methods
All statistical analyses were performed using “rms”, “Hmisc” and “ggplot2” packages (R Project version 4.00, Vienna, Austria). Continuous variables were expressed as median and interquartile range (IQR). Categorical variables were expressed as numbers and percentages. Mann Whitney U-test was used for comparison of independent variables and Pearson χ2-test or Fisher exact test for categorical variables. To determine independent predictors for disease severity, univariable (crude) and multivariable (adjusted) logistic regression analyses were used.
All analyses were based on non-missing data. The relative importance of each predictor in the models was estimated with a partial χ2 value, which estimates the independent contribution of each variable. Model performance was evaluated by a calibration plot. In addition, receiver operating characteristic (ROC) analysis was performed to determine an optimal cut-off value for PTX3 in predicting disease severity. For all statistical analyses, a p value of less than 0.05 was considered to be significant.
Results
A total of 102 patients diagnosed with COVID-19 were prospectively included in our study, 63 (61.8%) of them male, mean age 55 (range 42-63) years. The severity of COVID-19 was moderate in 55 and severe/critical in 47 patients. The mean duration of hospitalization was 9 (range 6-15) days. Six (5.9%) patients died, all of them with severe/critical COVID-19.
Older age, prolonged length of stay, hypertension, and need for intensive care were significantly more common and pulmonary involvement was more widespread in severe/critical patients. Laboratory findings are presented in Table 1. Patients with severe/critical COVID-19 had significantly higher levels of CRP, PCT, and plasma PTX3 (p<0.001).
Table 1. Baseline demographic, clinical, imaging and laboratory findings.
| Variable | All (N=102) |
Moderate (N=55) |
Severe/critical (N=47) |
p |
|---|---|---|---|---|
| Age (yrs) | 55 (42-63) | 46 (33.5-56) | 60 (54.5-70) | <0.001 |
| Gender (male, n, %) | 63 (61.8) | 29 (52.7) | 34 (72.3) | 0.07 |
| Length of hospital stay (days) | 9 (6-15) | 6 (5-9) | 14 (10-23) | <0.001 |
| DM (n, %) | 28 (27.5) | 11 (20) | 17 (36.2) | 0.070 |
| Hypertension (n, %) | 29 (28.4) | 10 (18.2) | 19 (40.4) | 0.010 |
| CAD (n, %) | 13 (12.7) | 4 (7.3) | 9 (19.1) | 0.070 |
| COPD (n, %) | 12 (11.8) | 4 (7.3) | 8 (17) | 0.130 |
| ICU need (n, %) | 8 (7.8) | 0 | 8 (17) | 0.001 |
| Death (n, %) | 6 (5.9) | 0 | 6 (12.8) | 0.006 |
| Pentraxin 3 | 4.40 (3.12-5.69) | 3.72 (2.99-5.02) | 5.25 (3.76-6.28) | <0.001 |
| WBC | 5.79 (4.64-7.06) | 5.5 (4.54-6.35) | 6 (4.97-8) | 0.03 |
| Neutrophils | 3.74 (2.73-4.89) | 3.26 (2.42-4.34) | 4.51 (3.19-5.88) | <0.001 |
| Lymphocytes | 1.3 (1-1.71) | 1.51 (1.25-1.96) | 1.12 (0.81-1.43) | <0.001 |
| Hemoglobin | 13.1 (11.5-14.6) | 13.1 (11.9-14.8) | 13 (11.1-14.3) | 0.250 |
| Platelets | 202 (162-243] | 201 (163-233) | 219 (161-270) | 0.47 |
| NLR | 2.67 (1.84-4.19) | 2.09 (1.46-3.24) | 3.89 (2.67-5.61) | <0.001 |
| C-reactive protein | 44.5 (14.6-96.6) | 20 (10-55.5) | 85 (42.8-137) | <0.001 |
| Procalcitonin | 0.07 (0.04-0.14) | 0.04 (0.03-0.07) | 0.12 (0.07-0.25) | <0.001 |
| Ferritin | 178 (82.2-380) | 109 (59.5-221) | 375 (165-585) | <0.001 |
| Fibrinogen | 397 (347-468) | 390 (349-446) | 412 (347-475) | 0.260 |
| Lactate dehydrogenase | 262 (215-371) | 229 (200-275) | 372 (261-430) | <0.001 |
| D-dimer | 0.22 (0.13-0.40) | 0.19 (0.12-0.37) | 0.32 (0.16-0.41) | 0.12 |
| Albumin | 38.8 (35.4-40.7) | 40 (38-43) | 36.4 (34.5-39.3) | <0.001 |
| Aspartate transaminase | 30.5 (24-48) | 27 (21-34) | 42 (27-54.5) | <0.001 |
| Alanine transaminase | 24 (16-41.5) | 23 (15-33) | 25 (17-46) | 0.300 |
| Urea | 28.2 (22-36.8) | 26 (21.3-33) | 32.5 (25-48) | 0.001 |
| Creatinine | 0.84 (0.67-1.05) | 0.73 (0.65-0.93) | 0.96 (0.76-1.15) | <0.001 |
| Creatine kinase | 112 (61.3-193) | 94 (59.5-153) | 131 (67-236) | 0.090 |
| Troponin I | 4 (3-9) | 3 (3-5) | 7 (4-12) | <0.001 |
| Prothrombin time | 14.6 (13.5-15.6) | 14.7 (13.6-15.5) | 14.5 (13.4-15-7) | 0.820 |
| aPTT | 37.8 833.5-41.6) | 35.4 (32.6-39.2) | 39.9 (36.6-43.5) | <0.001 |
| Pulmonary involvement on computed tomography (n, %) | ||||
| Low Intermediate Severe |
30 (29.4) 37 (36.3) 35 (34.3) |
28 (50.9) 23 (41.8) 4 (7.3) |
2 (4.3) 14 (29.8) 31 (66) |
<0.001 |
DM = diabetes mellitus; CAD = coronary artery disease; COPD = chronic obstructive pulmonary disease; ICU = intensive care unit; WBC = white blood count; NLR = neutrophil/lymphocyte ratio; aPTT = active partial thromboplastin time
In point biserial correlation analysis, PTX3 (r=0.406, p=0.01), PCT (r=0.652, p<0.001) and CRP (r=0.400, p=0.01) showed moderate correlations with disease severity (Table 2).
Table 2. Point biserial correlations between admission status and continuous variables.
| Variable | Correlation coefficient, r | p value |
|---|---|---|
| Age | 0.388 | 0.003 |
| Pentraxin 3 | 0.406 | 0.002 |
| D-dimer | 0.210 | 0.04 |
| Troponin I | 0.398 | 0.003 |
| Procalcitonin | 0.652 | <0.001 |
| C-reactive protein | 0.400 | 0.003 |
| Ferritin | 0.050 | 0.06 |
| Lactate dehydrogenase | 0.175 | 0.16 |
In crude logistic regression analysis, older age, increased creatinine, PTX3, lactate dehydrogenase (LDH), PCT, CRP and troponin-I levels were associated with disease severity (odds ratio [OR] 3.60 [95% confidence interval (95% CI) 1.85-6.98], p<0.001), (OR 6.96 [95% CI 2.45-19.80] p<0.001), (OR 3.12 [95% CI 1.58-6.15], p=0.001), (OR 7.88 [95% CI 3.23-19.21], p<0.001), (OR 3.81 [95% CI 1.80-8.05], p<0.001), (OR 6.01 [95% CI 2.63-13.71] p<0.001) and (OR 3.05 [95% CI 1.61-5.78], p<0.001, respectively) (Table 3).
Table 3. Binary logistic regression for predicting admission status (crude and adjusted).
| Variable | Crude odds ratio | Adjusted odds ratio | |||
|---|---|---|---|---|---|
| 95% CI | p value | 95% CI | p value | ||
| Age (from 42 to 63 years) | 3.60 (1.85-6.98) | <0.001 | 2.44 (1.10-5.41) | 0.006 | |
| Pentraxin 3 (from 3.37 to 5.38) | 6.96 (2.45-19.80) | <0.001 | 2.38 (1.21-4.72) | 0.01 | |
| Male gender | 2.34 (1.02-5.37) | 0.04 | 1.31 (0.40-4.35) | 0.03 | |
| Creatinine (from 0.67 to 1.05) | 3.12 (1.58-6.15) | 0.001 | 1.65 (0.79-3.42) | 0.17 | |
| Albumin (from 35.45 to 40.70) | 0.30 (0.16-0.58) | <0.001 | 0.96 (0.69-1.33) | 0.81 | |
| Lactate dehydrogenase (from 214.7 to 371) | 7.88 (3.23-19.21) | <0.001 | 4.08 (1.71-9.70) | 0.001 | |
| Procalcitonin (from 0.04 to 0.14) | 3.81 (1.80-8.05) | <0.001 | 1.04 (0.84-1.28) | 0.71 | |
| C-reactive protein (from 14.6 to 96.6) | 6.01 (2.63-13.71) | <0.001 | 1.64 (0.65-4.10) | 0.28 | |
| Troponin I (from 3 to 9) | 3.05 (1.61-5.78) | <0.001 | 1.61 (0.86-2.98) | 0.13 | |
| Diabetes mellitus | 2.26 (0.93-5.51) | 0.07 | 1.09 (0.32-3.67) | 0.88 | |
95% CI = 95% confidence interval
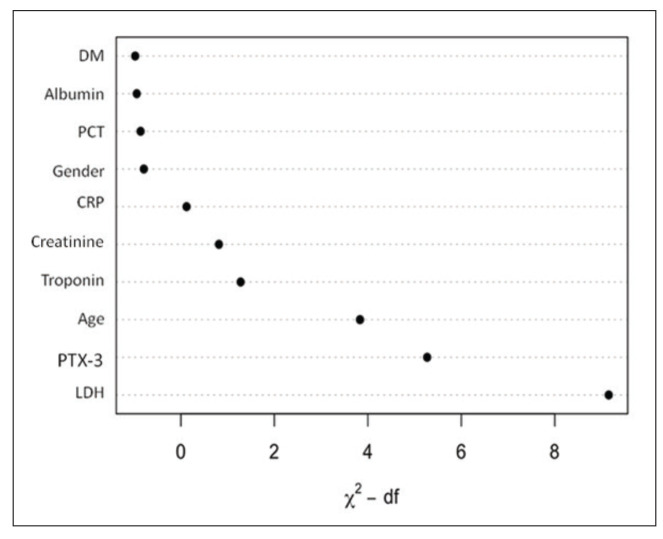
When the full model (multivariable model) was compared with the nested model (multivariable model without PTX3) using the likelihood ratio test, the result showed a significant difference (p=0.001). Thus, among the variables, PTX3 was the second most important explanatory variable following LDH (Fig. 2).
Fig. 2.
Relative importance of each predictor in multivariable regression model.
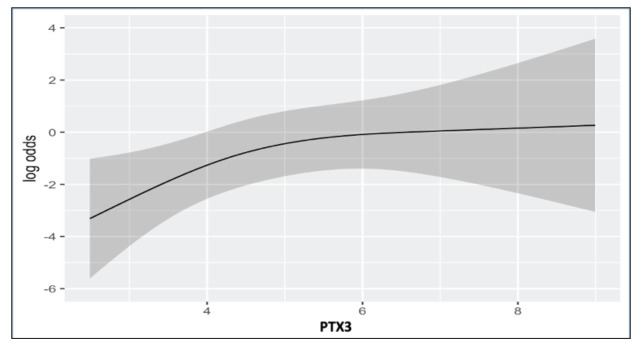
In multivariate logistic regression analysis, older age (OR 2.44 (95% CI 1.10-5.41) p=0.006) male gender (OR 1.31 [95% CI 0.40-4.35] p=0.03), increased LDH (OR 4.08 [95% CI 1.71-9.70] p=0.001) and PTX3 levels (OR 2.38 [95% CI 1.21-4.72] p=0.01) were found to be independent predictors of disease severity at admission (Table 3, Fig. 3).
Fig. 3.
Partial effect plot of PTX3 for predicting admission status while adjusted for all parameters in multivariable regression.
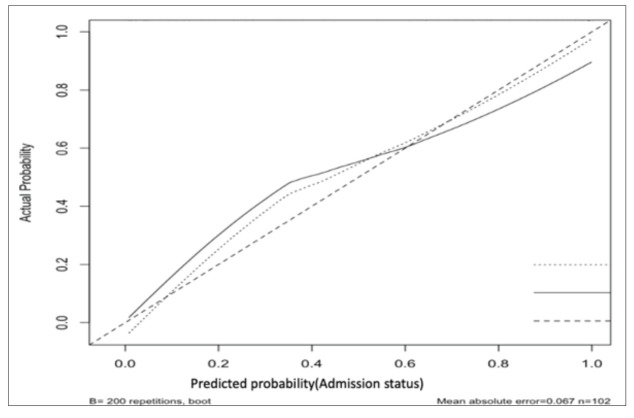
In ROC analysis, the area under the curve (AUC) was 0.788, yielding an optimal cut-off of 3.99 for PTX3 in predicting disease severity with 83.0% sensitivity and 67.3% specificity. In addition, internal validation made using a calibration plot showed that, when the predicted probability was below 60%, the regression model slightly overestimated disease severity (Fig. 4).
Fig. 4.
Corrected calibration of multivariable regression model for internal validation.
Discussion
In the current study, the relationship of PTX3 with the disease severity was evaluated in 102 patients hospitalized with COVID-19. In correlation analysis, PTX3, CRP and PCT were found to be corelated with disease severity. In multivariate analysis, gender, LDH and PTX3 were found to be independent predictors of disease severity. In ROC analysis, a cut-off value of 3.99 for PTX3 predicted disease severity with 83.0% sensitivity and 67.3% specificity.
There are few studies evaluating the value of PTX3 in predicting disease severity, particularly in the setting of COVID-19. In one study of patients hospitalized with COVID-19, elevated PTX3 levels were significantly associated with CRP, PCT, IL-6, ferritin, D-dimer, LDH, troponin I, lymphocyte count, and platelet count. PTX3 was also found to be a significant predictor of 28-day mortality (9). In another study, admission PTX3 was not only predictive of mortality but its combination with IL-6 and PCT yielded an even higher AUC than PTX3 alone (0.95 vs. 0.93). The authors also proposed that alveolar PTX3 levels might better reflect disease severity than plasma PTX3 levels (10). In a meta-analysis, elevated PTX3 levels not only significantly predicted sepsis but also increased the risk of all-cause mortality. In another meta-analysis, bronchoalveolar PTX3 levels were more predictive of disease severity than serum concentrations (12).
These findings along with our findings suggest that PTX3 can be utilized as an appropriate immunologic marker in predicting disease severity in COVID-19 patients. Compared with CRP, the increase of which can be detected after 24-48 hours, PTX3 may prove to be more practical with a shorter time of detection within 6-8 hours, as well as its local alveolar and epithelial expressions in response to pulmonary infections.
Limitations
The major limitation to the present study was its single-center and cross-sectional design with a small sample size. Another limitation was that PTX3 was studied mainly with respect to its relationship with disease severity rather than mortality.
Conclusions
As PTX3 is locally expressed in response to infections more rapidly than acute phase reactants such as CRP, it may become a candidate for predicting disease severity and mortality, particularly in the context of COVID-19.
Acknowledgment
The study was supported by The Scientific and Technological Research Council of Turkey (Project Number: 02.07.2020-2020/065).
References
- 1.Ingraham NE, Lotfi-Emran S, Thielen BK, Techar K, Morris RS, Holtan SG, et al. Immunomodulation in COVID-19. Ann Oncol. 2020. January;19-21: 10.1016/S2213-2600(20)30226-5 [DOI] [PMC free article] [PubMed] [Google Scholar]
- 2.Takeuchi O, Akira S. Innate immunity to virus infection. Immunol Rev. 2009. January;227(1):75–86. 10.1111/j.1600-065X.2008.00737.x [DOI] [PMC free article] [PubMed] [Google Scholar]
- 3.Felsenstein S, Herbert JA, McNamara PS, Hedrich CM. COVID-19: immunology and treatment options. Clin Immunol. 2020;215(April):108448. [Internet] 10.1016/j.clim.2020.108448 [DOI] [PMC free article] [PubMed] [Google Scholar]
- 4.Bottazzi B, Garlanda C, Teixeira MM. Editorial: The role of pentraxins: from inflammation, tissue repair and immunity to biomarkers. Front Immunol. 2019;10(Dec):2817. 10.3389/fimmu.2019.02817 [DOI] [PMC free article] [PubMed] [Google Scholar]
- 5.Porte R, Davoudian S, Asgari F, Parente R, Mantovani A, Garlanda C, et al. The long pentraxin PTX3 as a humoral innate immunity functional player and biomarker of infections and sepsis. Front Immunol. 2019;10(APR):794. 10.3389/fimmu.2019.00794 [DOI] [PMC free article] [PubMed] [Google Scholar]
- 6.Atik D, Kaya HB. Evaluation of the relationship of MPV, RDW and PVI parameters with disease severity in COVID-19 patients. Acta Clin Croat. 2021;60(1):103–14. 10.20471/acc.2021.60.01.15 [DOI] [PMC free article] [PubMed] [Google Scholar]
- 7.Shakoori TA, Hafeez MM, Malik A. Could COVID-19 be a hemoglobinopathy? Acta Clin Croat. 2020;59(4):740–4. 10.20471/acc.2020.59.04.21 [DOI] [PMC free article] [PubMed] [Google Scholar]
- 8.Mantovani A, Garlanda C, Doni A, Bottazzi B. Pentraxins in innate immunity: from C-reactive protein to the long pentraxin PTX3. J Clin Immunol. 2008;28(1):1–13. 10.1007/s10875-007-9126-7 [DOI] [PubMed] [Google Scholar]
- 9.Brunetta E, Folci M, Bottazzi B, De Santis M, Gritti G, Protti A, et al. Macrophage expression and prognostic significance of the long pentraxin PTX3 in COVID-19. Nat Immunol. 2021;22(1):19–24. [Internet] 10.1038/s41590-020-00832-x [DOI] [PubMed] [Google Scholar]
- 10.Schirinzi A, Pesce F, Laterza R, D’Alise MG, Lovero R, Fontana A, et al. Pentraxin 3: potential prognostic role in SARS-CoV-2 patients admitted to the emergency department. J Infect. 2021;82:84. 10.1016/j.jinf.2020.10.027 [DOI] [PMC free article] [PubMed] [Google Scholar]
- 11.World Health Organization (WHO). Clinical management of COVID-19 Interim Guidance 27 May 2020. Geneva WHO [Internet]; 2020. Available from: https://www.who.int/publications-detail/clinical-management-of-covid-19
- 12.Ye W, Huang QD, Tang TY, Qin GY. Diagnostic value of pentraxin 3 in respiratory tract infections: a meta-analysis. Medicine (Baltimore). 2020. April;99(14):e19532. 10.1097/MD.0000000000019532 [DOI] [PMC free article] [PubMed] [Google Scholar]


