In vivo reporter analysis of myeloid progenitor populations identifies the precise stage at which Myc expression switches to Mycl expression during dendritic cell development. Genetic analysis reveals that this switch is controlled in part by the transcription factor IRF8.
Abstract
During dendritic cell (DC) development, Myc expression in progenitors is replaced by Mycl in mature DCs, but when and how this transition occurs is unknown. We evaluated DC development using reporters for MYC, MYCL, and cell cycle proteins Geminin and CDT1 in wild-type and various mutant mice. For classical type 1 dendritic cells (cDC1s) and plasmacytoid DCs (pDCs), the transition occurred upon their initial specification from common dendritic cell progenitors (CDPs) or common lymphoid progenitors (CLPs), respectively. This transition required high levels of IRF8 and interaction with PU.1, suggesting the use of EICEs within Mycl enhancers. In pDCs, maximal MYCL induction also required the +41kb Irf8 enhancer that controls pDC IRF8 expression. IRF8 also contributed to repression of MYC. While MYC is expressed only in rapidly dividing DC progenitors, MYCL is most highly expressed in DCs that have exited the cell cycle. Thus, IRF8 levels coordinate the Myc-Mycl transition during DC development.
Introduction
Expression of the Myc family of transcription factors is precisely controlled to ensure mutually exclusive expression patterns during development (Hartl et al., 2010; Johnston et al., 1999; Young et al., 2011). Two transitions in MYC family member expression occur during hematopoiesis. The first transition occurs between expression of Mycn (N-Myc) in hematopoietic stem cells to expression of Myc (c-Myc) in multipotent progenitors (Laurenti et al., 2008; King et al., 2016). Myc remains the dominant family member expressed in proliferating oligopotent myeloid and lymphoid progenitor cells (Laurenti et al., 2008). A second transition occurs between expression of Myc in these progenitors and the expression of Mycl (L-Myc) in classical dendritic cells (cDCs) and plasmacytoid DCs (pDCs; Kc et al., 2014). Specific ubiquitin ligases have been identified that regulate MYCN and MYC protein levels during hematopoiesis (King et al., 2016; Reavie et al., 2010), but only recently has the genetic basis of Myc expression in hematopoietic progenitor populations been examined (Bahr et al., 2018). Until now, the basis for the switch from expression of Myc to expression of Mycl in DCs has not been identified.
Myc acts to support metabolic requirements in proliferating populations (Liu et al., 2007; Schlitzer et al., 2011; Schlitzer et al., 2012; Ardouin et al., 2016; Huang et al., 2008). In contrast, we found that Mycl supports the functions of type 1 cDCs (cDC1s; Kc et al., 2014), which have exited the cell cycle (Ardouin et al., 2016; Liu et al., 2007). Mice deficient in Mycl showed impaired priming of antigen-specific CD8+ T cells (Kc et al., 2014), and reduced genome-wide transcription of core metabolic genes (Anderson et al., 2020b). While it is unknown whether MYC and MYCL possess intrinsically different capacities for transcriptional regulation to explain these different roles, these results nonetheless suggest that replacing MYC with MYCL is important to maintain the normal function of DCs to support their role in the immune response.
A challenge in analyzing this transition previously was a limited knowledge of the various developmental stages of DCs in the bone marrow (BM). However, analyzing this transition has been facilitated by the recent identification of clonogenic progenitors of various DC subsets (Bagadia et al., 2019b; Dress et al., 2019; Grajales-Reyes et al., 2015; Rodrigues et al., 2018; Schlitzer et al., 2015). Pre-cDC1s, pre-cDC2s, and pre-pDCs were identified using single-cell transcriptome analysis and in vivo reporter expression that implied transcriptional circuits controlling progenitor specification and diversification (Anderson et al., 2020a; Bagadia et al., 2019a; Grajales-Reyes et al., 2015; Kim et al., 2020; Rodrigues et al., 2018; Schlitzer et al., 2015).
To identify the developmental stage for the transition from Myc and Mycl during DC development, we used in vivo GFP reporters for Myc and Mycl expression in WT mice as well as Irf8−/− mice and mice with deletion of the +41kb Irf8 enhancer. Our results uncover a previously unrecognized role for IRF8 in regulating the transition from Myc to Mycl expression during DC development.
Results
Mycl-GFP expression marks the pre-pDC and pre-cDC1, but not pre-cDC2, progenitor
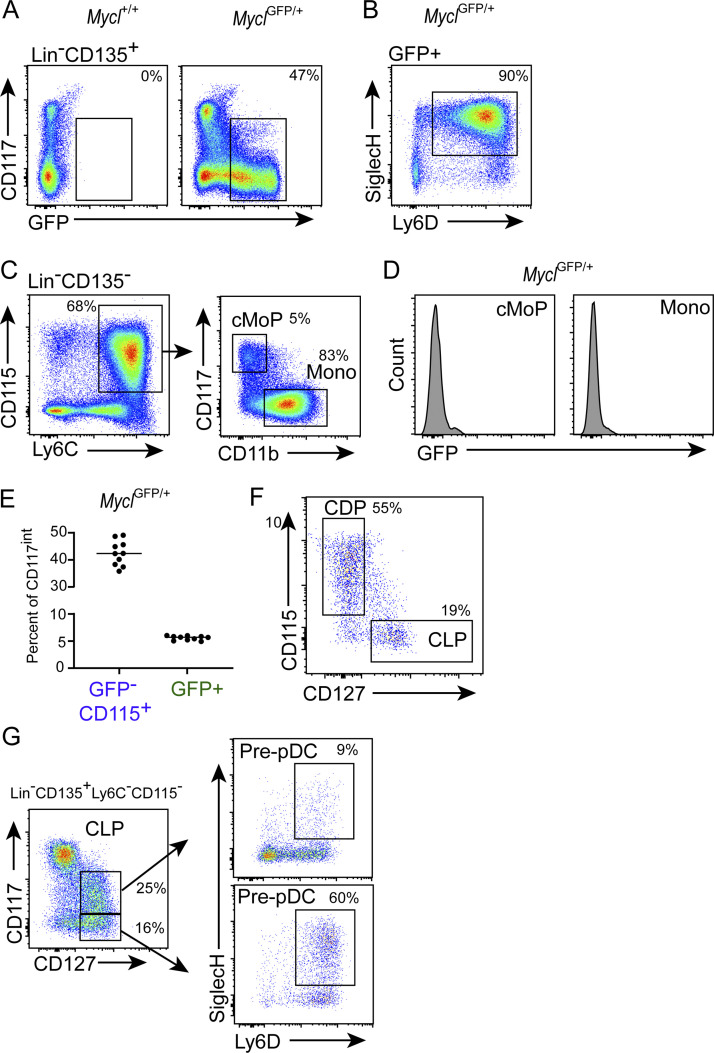
Clonogenic progenitors for DCs and monocytes include the pre-cDC1, pre-cDC2, pre-pDC, and common monocyte progenitor (cMoP; Bahr et al., 2018; King et al., 2016; Kc et al., 2014; Bagadia et al., 2019a; Durai et al., 2019; Grajales-Reyes et al., 2015; Naik et al., 2007; Onai et al., 2007; Dress et al., 2019; Rodrigues et al., 2018; Schlitzer et al., 2015). To define the expression of Myc and Mycl in these populations, we first analyzed Mycl-GFP mice (Kc et al., 2014). Consistent with our previous analysis (Kc et al., 2014), BM pDCs are the most abundant Mycl-GFP+ cells in the BM (Fig. S1, A and B). Monocytes were previously reported to lack Mycl-GFP expression, and we found that their progenitor, the cMoP, also lacks Mycl-GFP expression (Fig. S1, C and D; Anderson et al., 2020b; Kc et al., 2014).
Figure S1.
Mycl-GFP positive progenitors exist across heterogeneous populations of pDC and cDC1 restricted progenitors. (A) GFP expression by bulk Lin−CD135+ BM populations in Mycl+/+ and MyclGFP/+ mice. (B) Percentage of bulk BM pDCs among Mycl-GFP population gated in A. (C) Definition of monocytes (Mono) and cMoPs analyzed in D. (D) Mycl-GFP expression by the indicated populations. (E) Frequency of Mycl-GFP− CDPs (GFP−CD115+) and Mycl-GFP+ progenitors (GFP+) among Lin−CD11c−MHCII−CD135+CD117int BM cells (n = 10). (F) Frequency of CD127+ CLPs and CD115+ CDPs among Mycl-GFP+ progenitors shown in Fig. 1 A. (G) Frequency of pre-pDCs (Ly6D+SiglecH+) among CD117int and CD117low CLPs. All data are representative of at least three independent experiments (n = 5–10).
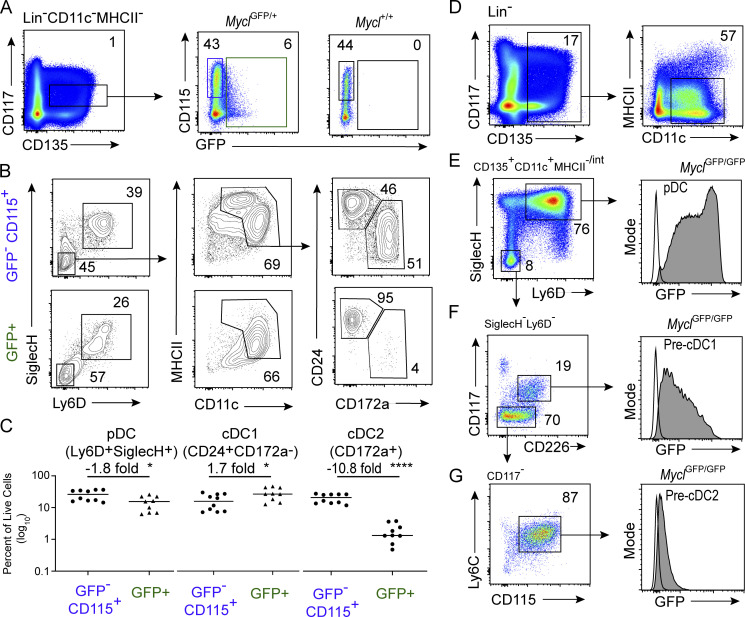
Specification of cDC occurs in the common DC progenitor (CDP), and pDC specification can occur in both the CDP and common lymphoid progenitor (CLP; Dress et al., 2019; Rodrigues et al., 2018; Schlitzer et al., 2015). Both progenitor populations have intermediate CD117 expression but differ in CD115 and CD127 expression, respectively (Bagadia et al., 2019a; Kondo et al., 1997; Manz et al., 2001; Sathe et al., 2013; Sathe et al., 2014; Schlenner et al., 2010; Shigematsu et al., 2004; Wu et al., 2001; Dress et al., 2019; Rodrigues et al., 2018; Schlitzer et al., 2015). Thus, we examined Mycl-GFP expression among Lin−CD135+ BM cells with intermediate CD117 expression containing both CDPs and CLPs (Lin−CD11c−MHCII−CD135+CD117int). We found ∼6% Mycl-GFP positivity in this heterogeneous population (Fig. 1 A and Fig. S1 E). When sorted and cultured in vitro with Flt3 ligand, Mycl-GFP+ progenitors produced cDC1s and pDCs, but notably did not produce cDC2s (Fig. 1, B and C). Further, we found that among Lin−CD135+CD117intMycl-GFP+ cells, 55% corresponded to CDPs (CD115+) and 19% to CLPs (CD127+; Fig. S1 F), suggesting that the Mycl is induced in specified progenitors of cDC1s and pDCs within both of these populations.
Figure 1.
MyclGFP expression identifies specified progenitors of pDCs and cDC1s but not cDC2s. (A) Frequency of Mycl-GFP expression among Lin−CD11c−MHCII−CD135+CD117int BM progenitors, gated to indicate populations sorted in B and C. (B) Analysis of sorted progenitor populations after 6 d of culture in Flt3l. (C) Quantification of pDCs (Ly6D+SiglecH+), CD11c+MHCII+ cDC1s (CD24+CD172a−), and cDC2s (CD172a+). (D–G) Lin−CD135+CD11c+MHCII−/int populations of the BM analyzed for Mycl-GFP expression including Ly6D+SiglecH+ pDCs in E, Ly6D−SiglecH−CD117intCD226+ pre-cDC1s in F, and Ly6D−SiglecH−CD117−CD115+Ly6C+ pre-cDC2s in G. MyclGFP/+ mice were used for A–C, and MyclGFP/GFP mice for D–G. Numbers inside flow cytometry panels quantify the frequency of indicated populations as a percentage of the parent gate. *, P < 0.05; ****, P < 0.0001. All data are representative of at least three independent experiments (n = 5–10).
Recent studies defining the pre-pDC within the CLP did not include an analysis of their level of CD117 expression (Dress et al., 2019; Rodrigues et al., 2018). Here we find that pre-pDCs are largely contained in the CD117low fraction of CLPs (Fig. S1 G). However, a minor population of pre-pDCs also exists in the CD117int fraction and can contribute to the pDC potential of CD117intMycl-GFP+ progenitors (Fig. 1, B and C; and Fig. S1 G). Specification of pre-cDC2s is reported to occur outside of the defined CDP within the CD117low fraction of BM, identified by expression of Zbtb46-GFP, Ly6C, and CD115 (Grajales-Reyes et al., 2015; Schlitzer et al., 2015). However, in contrast with pre-cDC1 and BM pDCs, we find that pre-cDC2 cells lack expression of Mycl-GFP (Fig. 1, D–G).
The MYC to MYCL transition occurs in specified DC progenitors
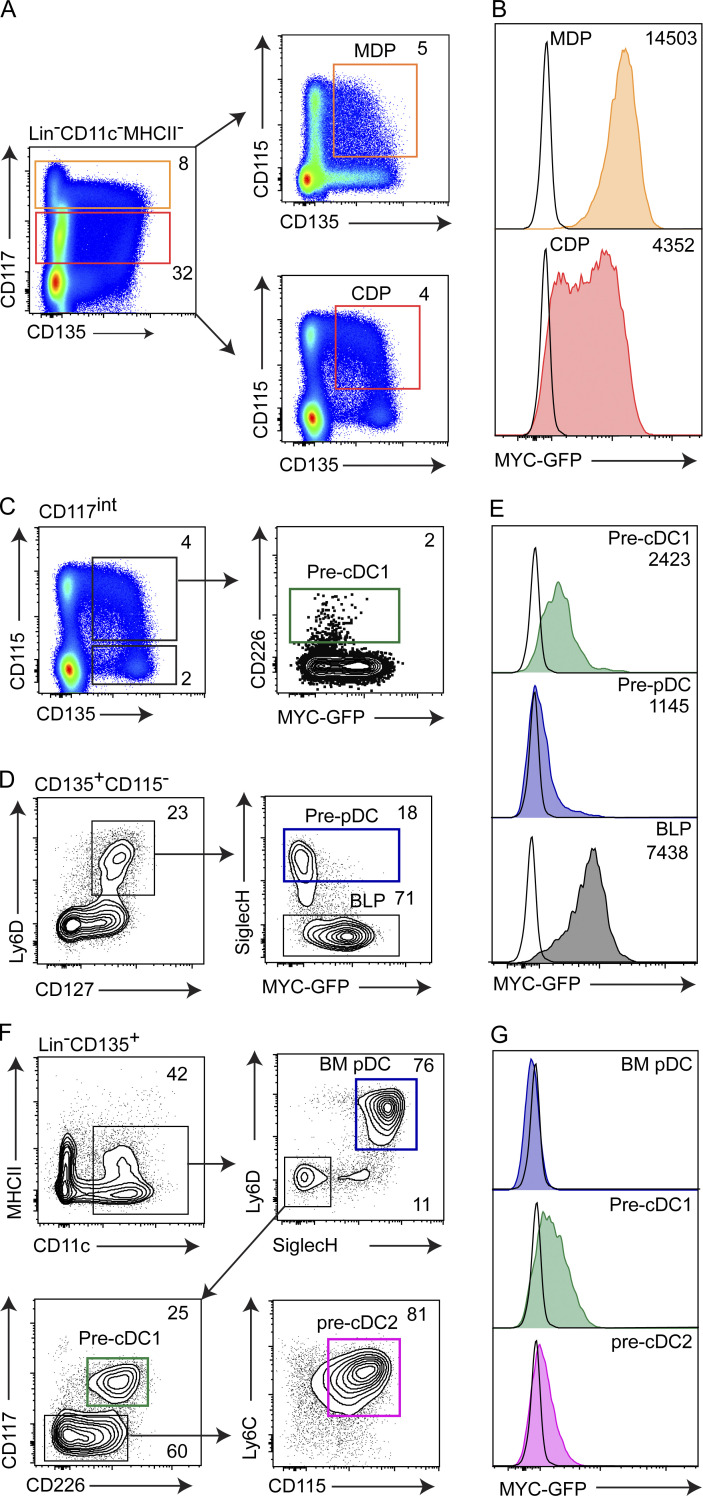
We next analyzed MYC-GFP expression in BM (Fig. S2; Huang et al., 2008; Kc et al., 2014). We find that macrophage and DC progenitors (MDPs) were uniformly positive, while CDPs exhibited bimodal expression of MYC-GFP (Fig. S2, A and B; Fogg et al., 2006; Liu et al., 2019; Naik et al., 2007; Onai et al., 2007). This result suggests that MYC repression may begin within CD117int CDPs, where cDC1 and pDC specification occurs (Bagadia et al., 2019a; Durai et al., 2019). Reduced MYC-GFP expression was observed in specified pre-cDC1s with a median fluorescence intensity (MFI) corresponding to the lower half of biomodal MYC-GFP expression in bulk CDPs (Fig. S2, C and E). Within the CLP (Lin−CD135+CD115−CD127+), MYC-GFP was expressed uniformly in the B cell–biased lymphoid progenitor (BLP; SiglecH−Ly6D+) but was not expressed by specified pre-pDCs (SiglecH+Ly6D+; Fig. S2, D and E; Inlay et al., 2009). Finally, pre-cDC2s also lose MYC-GFP on specification (Fig. S2 G). In summary, cDC and pDC specification in CDPs and CLPs coincides with repression of MYC-GFP.
Figure S2.
Specified populations of DC progenitors repress MYC. Flow cytometry analysis of MYC-GFP expression in BM populations of MycGFP/GFP mice. Representative gating schemes are illustrated for analysis of MDP and CDP (A and B); pre-cDC1, pre-pDC, and BLP (C–E); and BM-pDC, pre-cDC1, and pre-cDC2 (F and G). Numbers in flow cytometry plots represent percent frequency of the parent gate for the indicated populations, and MFI for single-color histograms of MYC-GFP expression. Data are representative of three independent experiments with two to five biological replicates each.
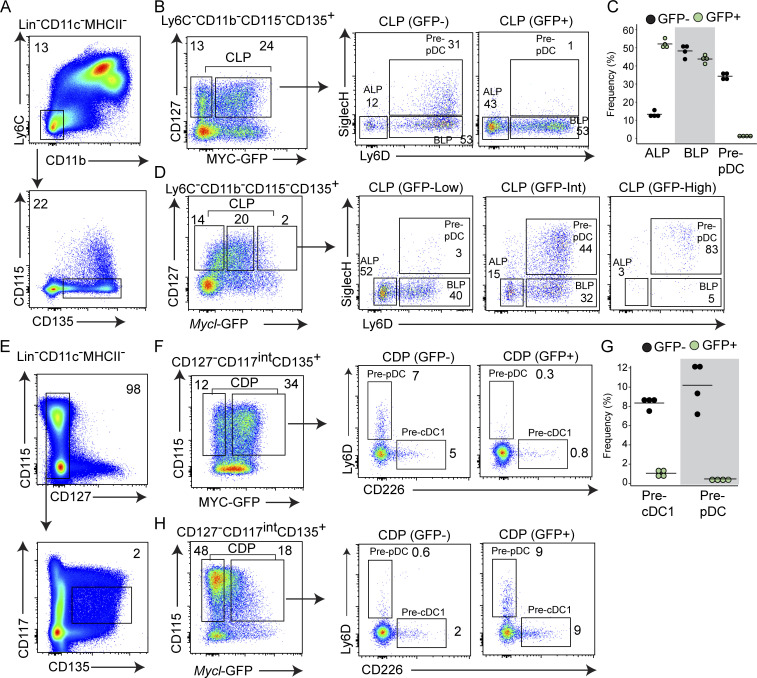
To test whether MYC and MYCL expressions are mutually exclusive, we compared the enrichment of specified pre-pDCs within MYC-GFP and Mycl-GFP fractions of the CLP (Fig. 2, A–D). In MycGFP/GFP mice, pre-pDCs were enriched in the MYC-GFP− fraction, suggesting pre-pDC specification coincides with MYC repression (Fig. 2, A–C). In contrast, unspecified all-lymphoid progenitors (ALPs) were enriched in the MYC-GFP+ fraction of the CLP (Inlay et al., 2009). We observed an opposite pattern of enrichment in CLPs from Mycl-GFP reporter mice. Within the CLP, pre-pDCs were enriched in the Mycl-GFPint-high fractions, whereas ALPs were enriched in the Mycl-GFPlow fraction (Fig. 2 D). These results demonstrate that pre-pDC specification within the CLP coincides with MYC repression and MYCL induction, suggesting their expression is mutually exclusive. In a similar analysis of specified pre-cDC1 (CD226+) and pre-pDC (Ly6D+) progenitors in the CDP, we again found these specified cells have both repressed MYC and induced MYCL (Fig. 2, E–H; Durai et al., 2019). Unable to use both GFP reporters simultaneously, this analysis does not exclude the existence of a minor population of progenitors that may express both MYC-GFP and Mycl-GFP simultaneously. However, as a whole, these results indicate a coordinated process of MYC repression and MYCL induction that occurs during pre-pDC and pre-cDC1 specification. For pDCs, this process occurs in both the lymphoid, CLP, and myeloid, CDP, branches of development, highlighting a presently unresolved convergence of pDC development from distinct myeloid and lymphoid-restricted progenitors.
Figure 2.
The switch from MYC to MYCL expression occurs within the CDP and CLP on pre-cDC1 and pre-pDC specification. (A) Representative pregating scheme for flow cytometry analysis of BM CLPs (Lin−CD11c−MHCII−Ly6C−CD11b−CD115−CD135+CD127+) from MycGFP/GFP and MyclGFP/GFP mice. (B and C) Frequency of ALPs (SiglecH−Ly6D−), BLPs (SiglecH−Ly6D+), and pre-pDCs (SiglecH+Ly6D+) within MYC-GFP− and MYC-GFP+ CD127+ CLPs from MycGFP/GFP mice, gated as in A. (B) Representative plot. (C) Data from four samples pooled from two independent experiments. (D) Frequency of ALPs, BLPs, and pre-pDCs within Mycl-GFPlow, Mycl-GFPint, and Mycl-GFPhigh CLPs from MyclGFP/GFP mice, as gated in A. (E) Representative pregating scheme for flow cytometry analysis of BM CD115+ CDPs (Lin−CD11c−MHCII−CD127−CD135+CD117int) from MycGFP/GFP and MyclGFP/GFP mice. (F and G) Frequency of pre-cDC1s (CD226+Ly6D−) and pre-pDCs among MYC-GFP− and MYC-GFP+ CD115+ CDPs. (F) Representative plot. (G) Data from four samples pooled from two independent experiments. (H) Frequency of pre-cDC1s (CD226+Ly6D−) and pre-pDCs among Mycl-GFP− and Mycl-GFP+ CD115+CDPs. Numbers inside flow cytometry panels quantify the frequency of indicated populations as a percentage of the parent gate.
Mycl1 expression in vivo requires Irf8
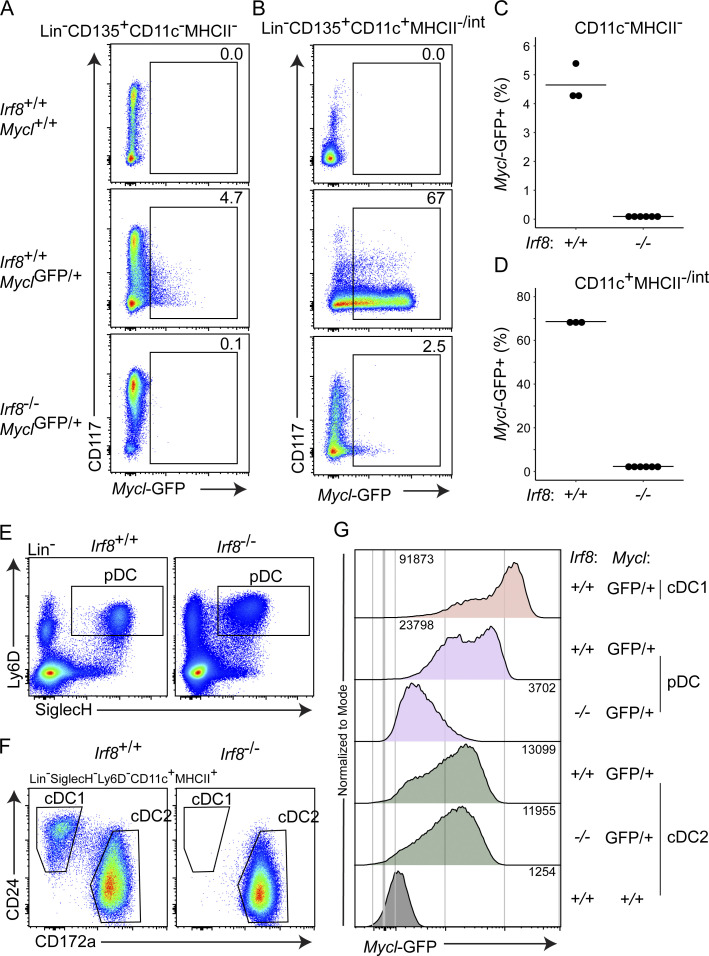
Irf8 is required for cDC1 development and pDC function (Aliberti et al., 2003; Schiavoni et al., 2002; Sichien et al., 2016), and expressed more highly in these cells compared with cDC2s. To test if Irf8 regulates Mycl expression, we examined Mycl-GFP expression in myeloid progenitors (Lin−CD135+CD11c−MHCII− cells) from Irf8+/+ and Irf8−/− mice (Fig. 3, A and C). We found that Irf8+/+ mice, but not Irf8−/− mice, contained GFP+ cells among CD135+ myeloid progenitors in the BM. Likewise, Irf8+/+ mice, but not Irf8−/− mice, had abundant Mycl-GFP+ cells in the Lin−CD135+CD11c+MHCII−/int fraction of BM, which include pre-cDC1s, pre-cDC2s, and pDCs (Fig. 3, B and D). These results are consistent with Irf8 support of Mycl induction during DC specification in the BM.
Figure 3.
IRF8 is required for Mycl induction and maintenance by pDCs but not cDC2s. (A–D) Flow cytometry analysis BM populations from mice of the indicated Mycl-GFP and Irf8 genotypes. (C and D) Quantification of frequency of MYCL-GFP+ cells gated in A and B, respectively. (E–G) Flow cytometry analysis of MYCL-GFP expression by pDCs (SiglecH+Ly6D+), cDC1s (CD24+CD172a−), and cDC2s (CD172a−) from the spleens of mice with the indicated genotypes. (G) MFI of MYCL-GFP expression for representative populations from E and F for the indicated genotypes. Data are representative of two independent experiments (n = 3–6).
We next asked whether Irf8 was also required to support Mycl-GFP expression in peripheral DCs in vivo (Fig. 3, E–G). The level of MYCL-GFP was reduced sixfold in splenic pDCs in Irf8−/−MyclGFP/+ mice compared with Irf8+/+MyclGFP/+ mice (Fig. 3, E–G). Mycl-GFP expression was unchanged in splenic cDC2s from an Irf8-deficient background, suggesting its low expression in cDC2 may be controlled by another factor, such as IRF4.
High IRF8 drives Mycl expression through interaction with PU.1
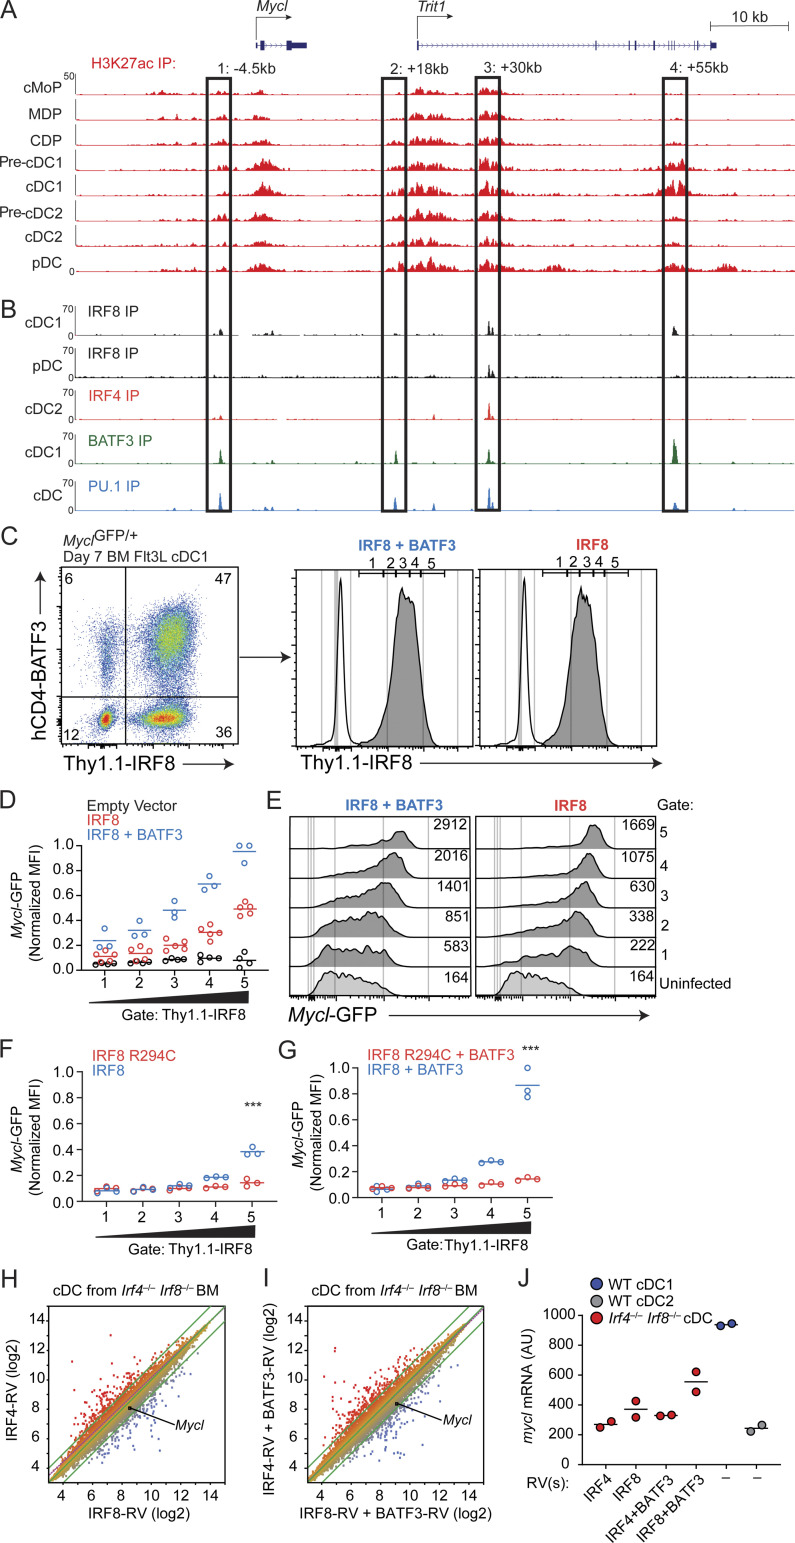
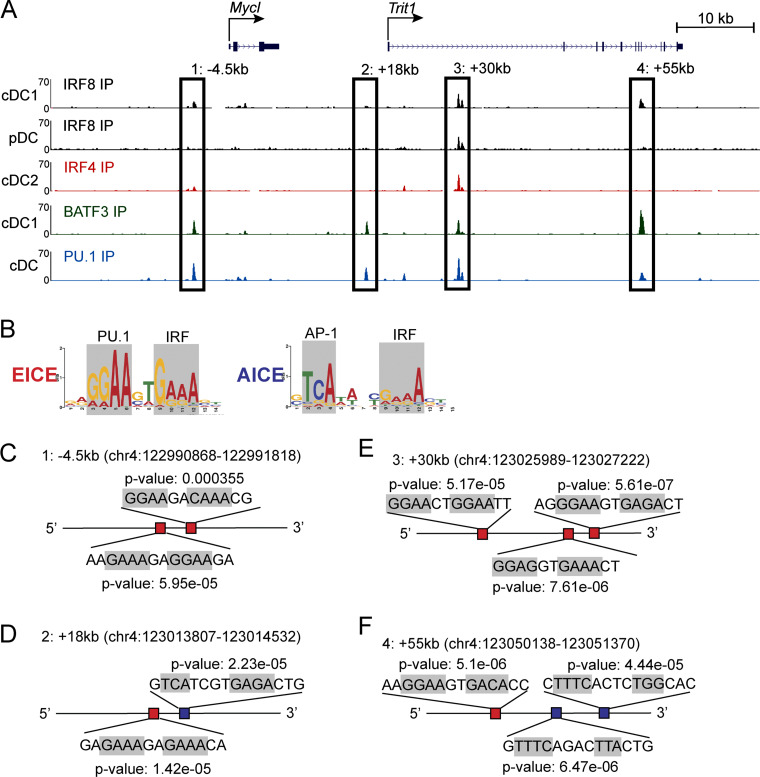
We next analyzed the Mycl gene locus for potential Irf8-responsive enhancers (Fig. 4, A and B). Chromatin immunoprecipitation sequencing (ChIP-seq) for H3K27ac in cMoPs, DC progenitors, and terminal DC subsets identified several potential Mycl enhancers. Four of these had colocalized IRF8 and PU.1 binding (Fig. 4, A and B), suggesting the presence of Ets-IRF elements (EICEs). IRF4, which is expressed in cDC2s, binds to the Mycl locus in cDC2s, at the same locations as IRF8 (Fig. 4 B). IRF8 and IRF4 can each interact with PU.1 at EICEs, and with BATF3 at AP1-IRF composite elements (AICEs; Kim et al., 2020). Across the Mycl locus, binding sites for IRF8 and IRF4 overlap with binding sites for PU.1 and BATF3 (Fig. 4 B). Each putative Mycl enhancer contains multiple EICEs and AICEs that were bound by IRF8 and PU.1 (Fig. S3).
Figure 4.
High IRF8 drives Mycl expression through interaction with PU.1. (A) H3K27ac ChIP-seq of the indicated populations for region surrounding the murine Mycl locus. (B) ChIP-seq of the indicated populations for IRF8, IRF4, BATF3, and PU.1 as labeled. (A and B) Putative enhancer regions are bound by a black box and defined by their distance from the transcription start site of Mycl. (C) Left: Flow cytometry analysis cDC1s (Ly6D−CD11c+MHCII+CD24+CD172−) derived from day 7 Flt3l cultured Lin−CD117high BM progenitors infected with two retroviruses, one overexpressing BATF3 and human CD4 as a selection marker, and another overexpressing IRF8 and Thy1.1 as a selection marker. Right: Histograms of Mycl-GFP expression are derived from the indicated populations and gated into five subpopulations on the basis of Thy1.1-IRF8 expression levels. (D) Quantification of Mycl-GFP expression (MFI) in Irf8+/+MyclGFP/+ cDC1s as a function of Thy1.1-IRF8 expression levels in BM progenitor populations infected with empty vectors, Thy1.1-IRF8 infected, or hCD4-BATF3 double-infected populations. Samples were normalized to maximum GFP signal detected among gates 1–5 for each independent experiment. (E) Representative histograms from which MFIs are derived in F as a function IRF8 expression levels defined by gates 1–5 in C. (F and G) As described in D, BM progenitors from Irf8−/−MyclGFP/+ infected with Thy1.1-IRF8 or Thy1.1-IRF8-R294C with (G) or without (F) hCD4-BATF3. ***, P < 0.001. Data are representative of two independent experiments (n = 3–5). (H–J) Expression microarray analysis (n = 2) of cDCs generated by culturing whole BM from Irf4−/−Irf8−/− in Flt3l for 9 d, with retroviral overexpression of either Irf4 or Irf8 (H), or coexpression of Irf4 or Irf8 with Batf3 (I). (J) Mycl expression levels are quantified from duplicate experiments (H and I) relative to WT Flt3l-cultured cDC1 and cDC2. IP, immunoprecipitation.
Figure S3.
EICE and AICE motifs are enriched at IRF8- and PU.1-binding sites at putative enhancers of Mycl. (A) Schematic representation of putative enhancer regions defined in Fig. 4 A over ChIP-seq tracks for IRF8, IRF4, BATF3, and PU.1 in the indicated cell types. (B) Representative EICE (red) and AICE (blue) DNA binding motifs with PU.1, IRF, and AP-1 binding motifs highlighted. (C–F) Motif analysis of the indicated putative enhancer regions, highlighting predicted AICE and EICE motifs and their respective P value from Find Individual Motif Occurrences analysis. IP, immunoprecipitation.
To ask if Mycl expression responds to IRF8, we expressed Irf8 by retrovirus into BM progenitors from MyclGFP/+ mice and analyzed GFP expression in DCs developing from Flt3L cultures (Fig. 4, C–G). GFP expression was analyzed as a function of Thy1.1 marker expression, where Thy1.1 serves as a surrogate for IRF8 expression levels, as previously described (Kim et al., 2020). We observed a continuous increase in Mycl-GFP expression with increasing Thy1.1, suggesting a dependence on IRF8 levels (Fig. 4, D and E). Since retroviral Irf8 expression can be enhanced by coexpression of Batf3 (Grajales-Reyes et al., 2015; Kim et al., 2020), we independently coexpressed Batf3, finding that combined IRF8 and BATF3 expression induced maximal Mycl-GFP expression in cDC1s (Fig. 4, D and E).
To exclude contributions of endogenous Irf8 to Mycl-GFP expression, we retrovirally expressed Irf8 in BM progenitors from Irf8−/−MyclGFP/+ mice and repeated the analysis of Mycl-GFP expression as a function of Thy1.1-Irf8 (Fig. 4, F and G). In addition, we overexpressed Irf8 with the R294C mutation, which prevents IRF8-PU.1 interactions (Grajales-Reyes et al., 2015; Turcotte et al., 2004; Turcotte et al., 2005). Compared with WT Irf8, the Irf8R294C failed to induce maximal Mycl-GFP expression in cDCs (Fig. 4 F), either expressed alone or with Batf3 coexpression. This result suggests that Mycl expression is driven primarily through EICEs binding IRF8:PU1 complexes, rather than AICEs binding IRF8:BATF3 complexes (Fig. 4 G). Together, these data demonstrate that Mycl transcription is increased proportionately to the amount of IRF8, primarily through interactions with PU.1.
Given that Mycl-GFP by cDC2s does not require Irf8, we hypothesized that Irf4 acts to support Mycl-GFP expression in this subset, albeit at ∼10-fold lower levels compared with cDC1s in vivo (Fig. 3 G). This hypothesis is supported by the presence of an IRF4-binding site by ChIP-seq at a +30kb putative enhancer of Mycl, which can also be bound by IRF8 and PU.1 (Fig. 4, A and B). We tested whether IRF4 can drive Mycl expression by retrovirally expressing Irf4 or Irf8 in cDCs derived from Irf4−/−Irf8−/− BM, eliminating the contribution of endogenous IRF8 or IRF4. By expression microarray analysis, we found that Irf4 overexpression was sufficient to drive Mycl-GFP expression at a similar magnitude to cDC2s derived from Irf4+/+Irf8+/+ BM (Fig. 4, H–J). However, it should be noted that an empty vector negative control could not be included because cDCs fail to develop from Irf4−/−Irf8−/− BM without ectopic expression of either Irf4 or Irf8. Therefore, it remains possible that Irf4 overexpression restores cDC development but that an alternative molecule is required to directly support Mycl expression. Despite this limitation, the data presented here provide strong support for a role of IRF4 in the expression of Mycl in cDC2s.
Irf8 is required for MYC repression during DC and monocyte development
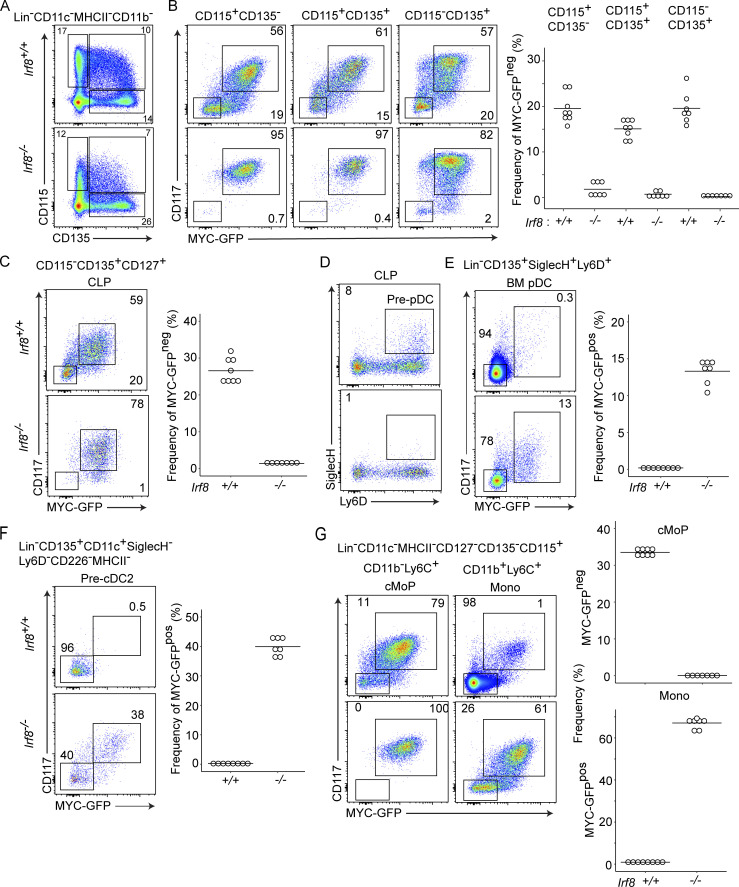
To determine whether Irf8 is also required for repression of MYC-GFP in vivo, we analyzed MYC-GFP expression in monocyte and DC progenitors from MycGFP/GFP mice that were either Irf8+/+ or Irf8−/− (Fig. 5). We first examined Lin− BM populations pregated according to CD115 and CD135 expression in order to encompass all progenitors of monocytes and DCs (Fig. 5 A). Irf8+/+ progenitors, whether single or double positive for CD115 and CD135, contained a subset of cells that were CD117− MYC-GFPneg, which were absent or reduced in their Irf8−/− counterparts (Fig. 5 B).
Figure 5.
MYC repression requires Irf8 on specification of DC and monocyte (Mono) progenitors. (A) Flow cytometry comparing gated populations in the BM of Irf8+/+MycGFP/GFP and Irf8−/−MycGFP/GFP mice. (B) Populations gated in A are labeled above, analyzed on the basis of CD117 and MYC-GFP expression for the indicated genotypes, and quantified. (C) Frequency of the populations defined in B on the basis of CD115 and CD135 expression, as labeled. The top panel with filled circles corresponds to CD117+MYC-GFP+ populations, and the bottom panel with open circles corresponds to the CD117−MYC-GFP− population. (D) Analysis of CD117 and MYC-GFP expression in the CLP from BM of the indicated genotypes. (E) As defined in D, the frequency of pre-pDCs within the CLP is analyzed on the basis of Ly6D and SiglecH expression. (F) Expression of CD117, MYC-GFP, analyzed for BM-pDCs. (H) Expression of CD117, MYC-GFG is analyzed for pre-cDC2s. (I) Expression of CD117, MYC-GFG is analyzed for cMoPs and monocytes. Numbers inside flow cytometry panels quantify the frequency of indicated populations as a percentage of the parent gate. All analysis is representative of populations in the BM of mice with the indicated genotypes. Data are representative of two independent experiments (n = 7 or 8).
We next examined pDCs, pre-pDCs, and pre-cDC2, which normally do not express Myc (Fig. 2; and Fig. S2, D–G). The CLP is a CD127+ subset of CD115−CD135+ cells, which contains pDC progenitors (Fig. 5 C). Irf8+/+ CLPs contained CD117−MYC-GFPneg cells as well as SiglecH+Ly6C+ pre-pDCs, both of which were nearly absent in Irf8−/− CLPs (Fig. 5, C and D). pDCs have been shown to develop in IRF8-deficient mice (Sichien et al., 2016). Although lower in frequency compared with Irf8+/+ mice, BM pDCs from Irf8−/− mice expressed normal levels of lineage markers Ly6D and CD11c, but failed to completely repress MYC-GFP in the CD117int gate (Fig. 5 E). Similarly, pre-cDC2s from Irf8+/+ mice were completely CD117−MYC-GFPneg, but some Irf8−/− pre-cDC2s remained CD117+ and MYC-GFPpos (Fig. 5 F). In summary, repression of Myc during DC specification requires Irf8. Because MYC-GFP de-repression was only partial in Irf8-deficient pre-cDC2s and BM pDCs (Fig. 5, E and F), additional factors likely contribute to repress Myc in specified populations.
Last, we examined Irf8+/+ and Irf8−/− cMoPs and monocytes for MYC-GFP expression (Fig. 5 G). Lin−CD135−CD115+ BM cells include Ly6C+ cells that are either CD11b− or CD11b+ (Fig. 5 G). In Irf8+/+ mice, CD11b−Ly6C+ cells can be separated further into a CD117+ population of MYC-GFPpos cMoPs and a CD117− population that is MYC-GFPneg, which is missing in Irf8−/− mice (Fig. 5 G). This CD117− has not been defined in the literature, but may represent a cMoP-like population in transition to monocytes but yet to acquire CD11b expression. In Irf8+/+ mice, CD11b+Ly6C+ cells contain mostly MYC-GFPnegCD117− monocytes, which are reduced in Irf8−/− mice (Fig. 5 G). Similarly, within the Ly6C+CD11b+ fraction containing mostly monocytes, a rare and undefined population of CD117+MYC-GFP+ cells is expanded in Irf8-deficient mice (Fig. 5 I). In summary, repression of Myc during monocyte development requires Irf8. Similar to what was observed in specified DC populations, Irf8 deficiency only partially de-repressed MYC in monocytes, suggesting that additional yet unidentified factors contribute to repress MYC in cooperation with IRF8.
The +41kb enhancer of Irf8 supports maximal MYCL in terminal pDCs
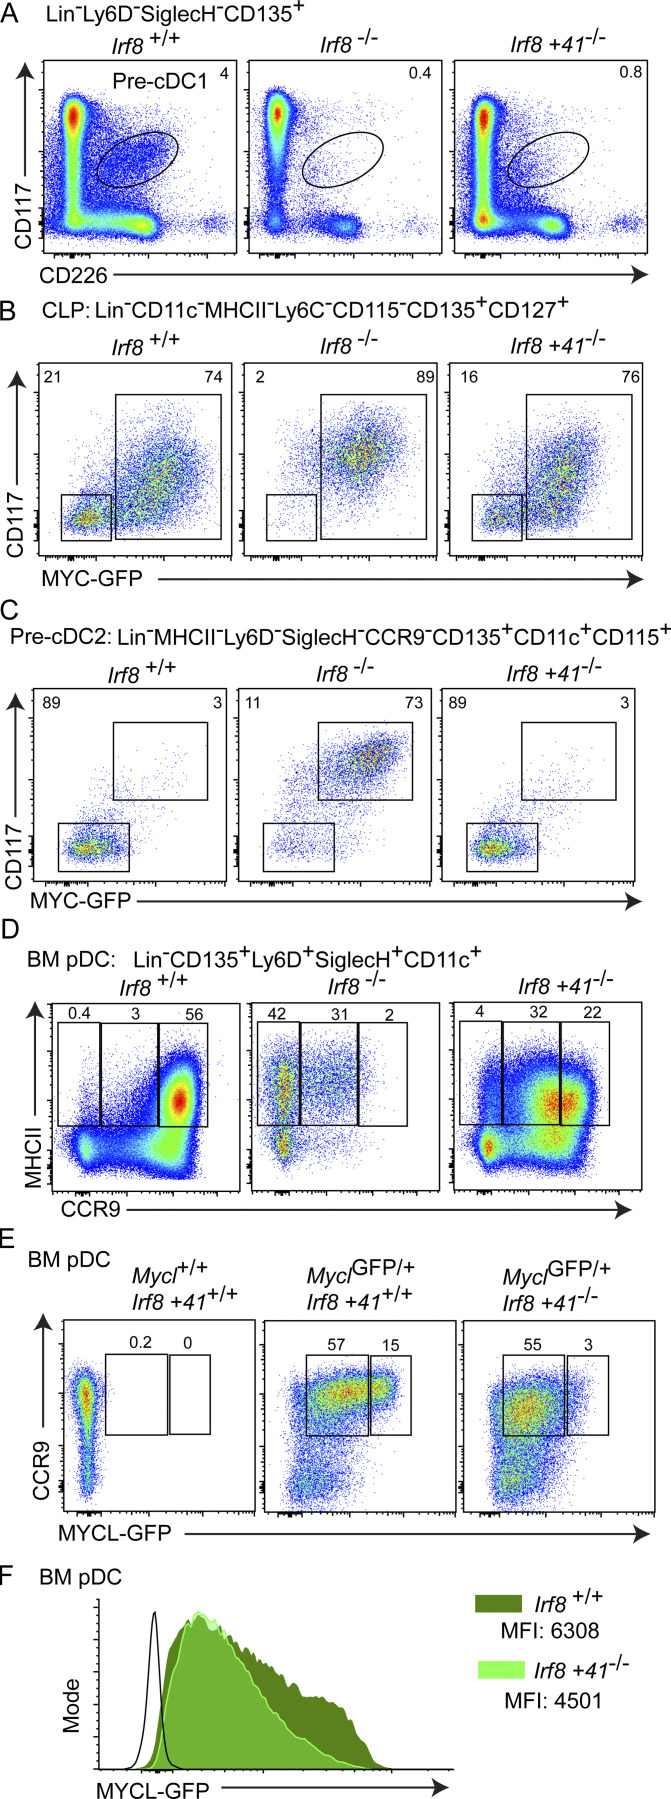
The Irf8 +41kb enhancer maintains IRF8 expression in pDCs, and drives an increase in IRF8 expression in CDPs relative to MDPs (Durai et al., 2019). We asked if this increase in IRF8 expression contributes to Myc repression and Mycl induction in DC progenitors by crossing Irf8+41−/− to MycGFP/GFP mice (Fig. 6). As a positive control, pre-cDC1 specification was impaired in both Irf8−/−MycGFP/GFP and in Irf8+41−/−MycGFP/GFP mice (Fig. 6 A). Within the CLP, MYC-GFP expression was reduced in Irf8+41−/−MycGFP/GFP similarly to Irf8+/+ MycGFP/GFP (Fig. 6 B). Likewise, the +41kb enhancer of Irf8 was not required for MYC-GFP repression in pre-cDC2s since Irf8+41−/−MycGFP/GFP mice produced CD117−MYC-GFPneg pre-cDC2 populations (Fig. 6 C). Therefore, we conclude that the early requirement for the Irf8 +41kb enhancer for IRF8 expression in the CDP does not correlate with de-repression of MYC-GFP, as observed in Irf8−/− mice.
Figure 6.
The +41kb Irf8 enhancer is required pDC maturation but not MYC repression on specification. (A) CD117intCD226+ pre-cDC1s. (B) ALP (SiglecH−Ly6D−), BLP (SiglecH−Ly6D+), and pre-pDC (SiglecH+Ly6D+) populations illustrated above, and the same bulk pregate population illustrated on the basis of MYC-GFP and CD117 expression. (C) Bulk BM pDCs illustrated on the basis of CCR9 and MYC-GFP expression above, or maturation markers CCR9 and MHCII below. (D) Analysis of BM pDCs on the basis of Mycl-GFP and CCR9 expression for the indicated genotypes on a MyclGFP and Irf8 +41kb−/− background. (E) Pre-cDC2s illustrated on the basis of Ly6C and MYC-GFP expression above, and CD117 and MYC-GFP expression below. Flow cytometry of BM from mice with the indicated genotypes on the MycGFP/GFP background. All populations quantified as percent frequency of the parent population defined by the indicated pregate. Data are representative of two independent experiments (n = 6). (F) Mycl-GFP expression in bulk BM pDCs as defined in D for the indicated genotypes.
We next asked whether the terminal stages of pDC development and maturation are affected by loss of the +41kb enhancer of Irf8. Mature BM pDCs, marked by high CCR9 and MHCII expression, are largely absent in Irf8−/− mice (Fig. 6 D). In Irf8+41−/− MyclGFP/GFP mice, a similar but partial defect in pDC maturation was observed, with a 10-fold increase in pDCs that express intermediate levels of CCR9 (Fig. 6 D). The highest amount of Mycl-GFP expression was observed in a fraction of mature, CCR9+ BM pDCs (Fig. 6 E). This Mycl-GFPhigh population of mature BM pDCS was reduced fivefold in Irf8+41−/−MyclGFP/GFP mice (Fig. 6, E and F). These results suggest that the Irf8 +41kb enhancer is required to achieve maximal levels of Mycl expression during pDC maturation (Fig. 6, E and F).
Irf8 controls cell cycle regulatory genes during pDC maturation
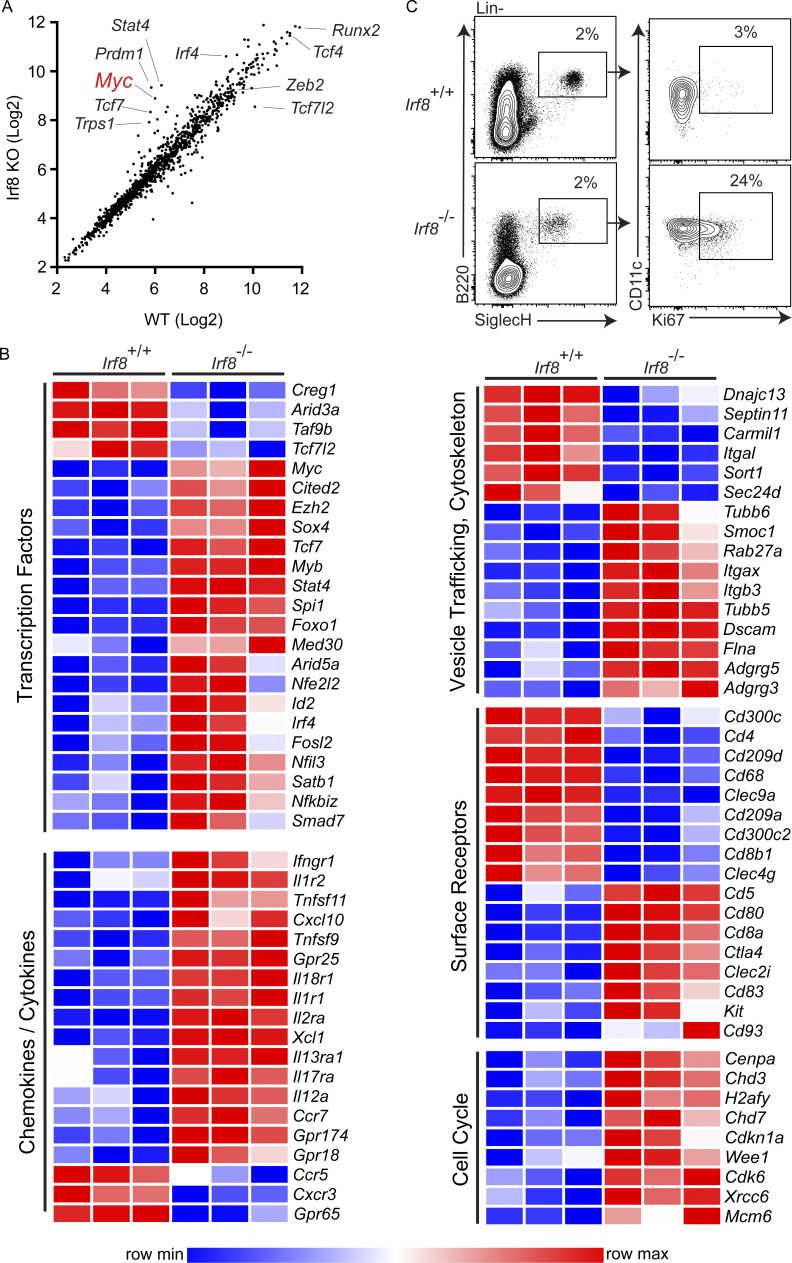
Since Irf8 is required to repress Myc expression during DC development, we compared the transcriptional profile of WT and Irf8−/− pDCs (Fig. S4 A). As expected, Myc expression was increased, by sevenfold, in Irf8−/− pDCs compared with WT pDCs. Also, expressions of Tcf4, Zeb2, and Runx2 were not differentially expressed between Irf8−/− and Irf8+/+ pDCs, in agreement with a previous study of Irf8-deficient pDCs (Sichien et al., 2016). However, more than twofold changes, both increased and decreased, were found for many classes of genes, including transcription factors and surface receptors (Fig. S4 A). Notably, a number of genes with functions related to cell cycle regulation, such as Cdk6, Mcm6, and Cenpa, were all increased (Fig. S4 B), suggesting a maintenance of proliferation rather than the cell cycle exit normally seen in mature pDCs. Consistently, Ki-67 was expressed in Irf8−/− pDCs but not WT pDCs (Fig. S4 C).
Figure S4.
Splenic pDCs fail to exit the cell cycle and repress Myc in Irf8−/− mice. (A and B) Expression microarray analysis of pDCs (B220+SiglecH+) sorted from the spleens of Irf8+/+ and Irf8−/− mice (n = 3). (A) Average signal intensity of transcription factor probe sets for the indicated genotypes, with select probe sets annotated with corresponding gene symbols. (B) Heat map of differentially expressed genes (minimum twofold differential expression) grouped by gene ontology biological process annotations, as indicated. (C) Flow cytometry analysis of Ki-67 intracellular staining of splenic pDCs from Irf8+/+ and Irf8−/− mice (n = 5, two independent experiments).
Mycl-GFP is induced on specification and elevated on cell cycle exit
We next examined the cell cycle status of DC progenitors in the context of Mycl expression by crossing MyclGFP mice with Fucci2 reporter mice (Fig. 7 and Fig. S5; Zielke and Edgar, 2015; Abe et al., 2013). On the MyclGFP background, the Fucci2 reporter contains a bicistronic transgene encoding fusion proteins for human CDT-mCherry and human Geminin-Venus, which mark cells in the G0-G1 or M phase, respectively.
Figure 7.
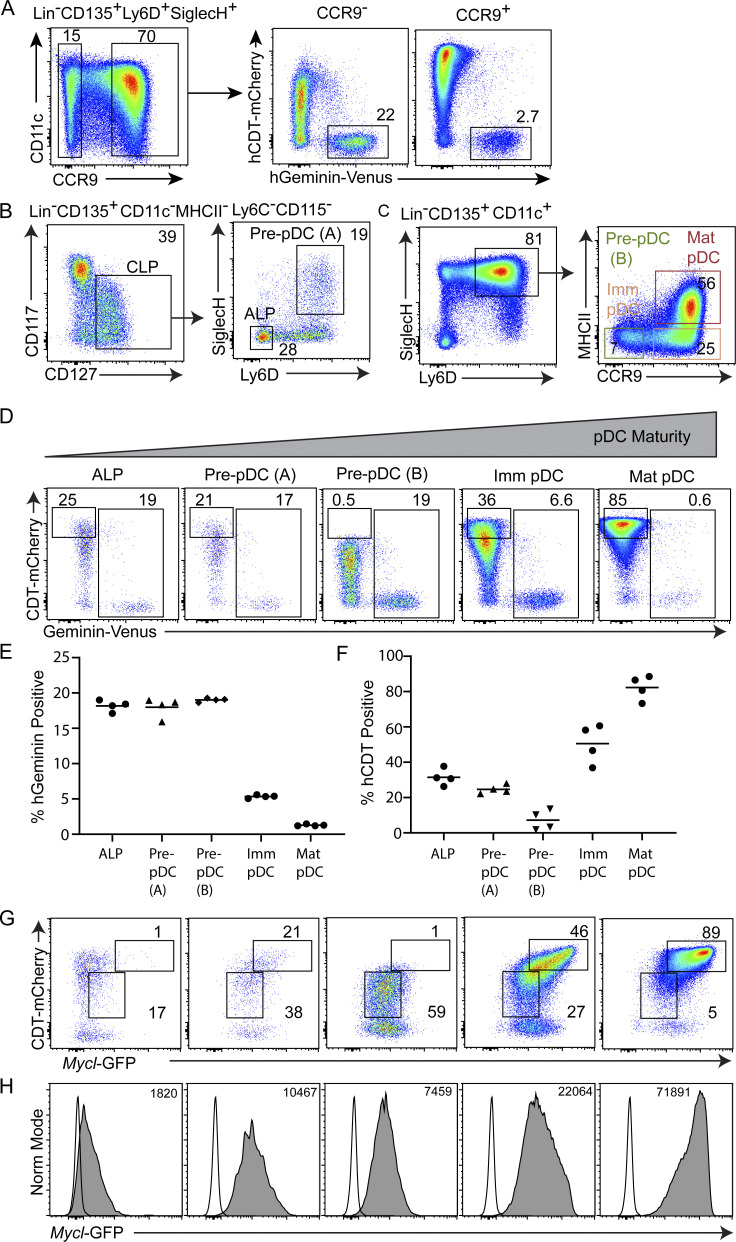
MYCL expression is maintained in proliferating pre-pDCs and elevated on terminal differentiation in the BM. (A) Frequency of M phase cycling cells (hGeminin-Venus+) among bulk CC9+ and CCR9− BM pDCs. (B and C) Representative gating scheme for flow cytometry analysis of lymphoid progenitor populations, pre-pDCs, immature, and mature BM pDCs in Fucci2+Myclgfp/gfp mice. (D) Fucci2 cell cycle analysis on the basis of hGeminin-Venus and hCDT-mCherry expression for the indicated populations, defined in B and C. (E and F) Quantification of the frequency of hGeminin-Venus/YFP+ and hCDT-mCherryhigh for the indicated populations. (G) Mycl-GFP and CCR9 expression analyzed for the populations indicated above in D. (H) Mycl-GFP expression for the populations indicated above in D. Numbers indicate MFI. (D) Analysis of hCDT-mCherry and Mycl-GFP expression for the populations indicated in D in Fucci2 hemizygous MyclGFP/+ mice. All data are representative of two independent experiments (n = 4). Populations were defined as follows: ALP defined as Lin−CD135+CD11c−MHCII−Ly6C−CD115−CD127+CD117int-lowLy6D−SiglecH−, pre-pDC (A) defined as Lin−CD135+CD11c−MHCII−Ly6C−CD115−CD127+CD117int-lowLy6D+SiglecH+, pre-pDC (B) defined as Lin−CD135+CD11c+CD115−Ly6D+SiglecH+CCR9−MHCII−, immature (Imm) pDC defined as Lin−CD135+CD11c+CD115−Ly6D+SiglecH+CCR9+MHCII−, and mature (Mat) pDC defined as Lin−CD135+CD11c+CD115−Ly6D+SiglecH+CCR9+MHCII+. Data are representative of two independent experiments (n = 4). Norm, normal.
Figure S5.
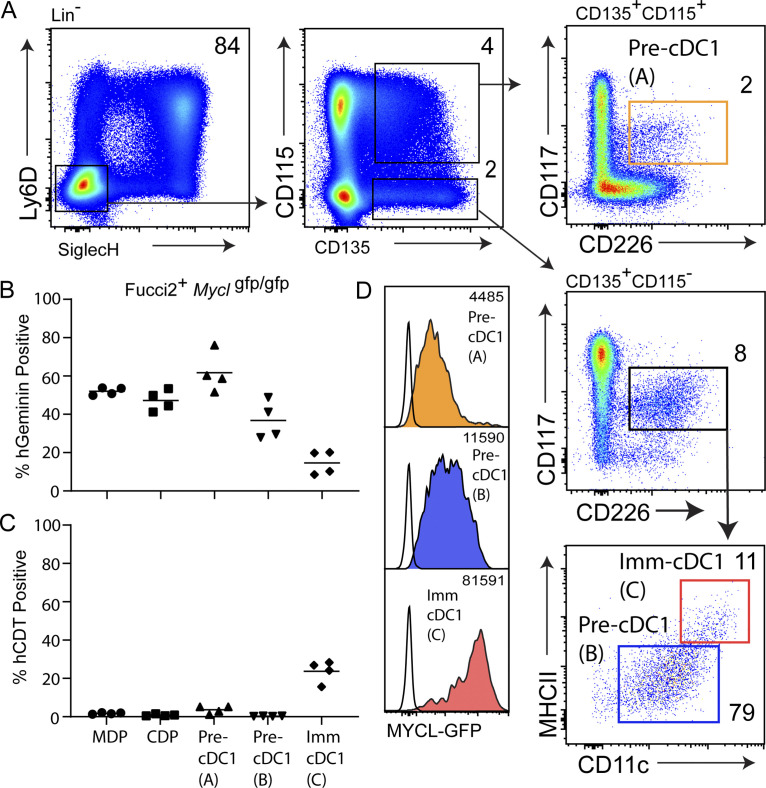
Reduced cell cycling and high Mycl-GFP expression correlate with commitment of pre-cDC1s to immature cDC1s. (A) Representative gating scheme for flow cytometry analysis of cDC1s and cDC1 precursors in the BM of Fucci2+Myclgfp/gfp mice. (B and C) Cell cycle analysis on the basis of Geminin-Venus and CDT-mCherry expression, quantified as illustrated in Fig. 2. (D) Mycl-GFP expression for the indicated populations. Histograms are color-coded and correspond to gated populations as defined in A. Numbers inside flow cytometry panels quantify the frequency of indicated populations as a percentage of the parent gate. All data are representative of two independent experiments (n = 4). Pre-cDC1 (A), labeled in orange, defined as Lin−Ly6D−SiglecH−CD135+CD115+CD117intCD226+; pre-cDC1 (B), labeled in blue, defined as Lin−Ly6D−SiglecH−CD135+CD115−CD117intCD226+CD11c+MHCIIint; immature (Imm) cDC1, labeled in red, defined as Lin−Ly6D−SiglecH−CD135+CD115−CD117intCD226+CD11chighMHCIIhigh.
We first analyzed cell cycle status for the trajectory of pDC development (Fig. 7 A). Comparing CCR9+ and CCR9− pDCs confirmed that the CCR9− fraction is enriched in progenitors, as indicated by their higher M phase frequency (Fig. 7 A). Cycling pDC progenitors have been described in both CD11c+ and CD11c− fractions of BM (Dursun et al., 2016; Schlitzer et al., 2011; Schlitzer et al., 2012). In the CD11c− fraction, the heterogeneous CLP contains the pre-pDC, referred to here as the pre-pDC (A) (Ly6D+SiglecH+), ALP (Ly6D−SiglecH−), and BLP (Ly6D+SiglecH−; Inlay et al., 2009). In the CD11c+ fraction, three populations of pDC progenitors and BM pDCs can be defined on the basis of CCR9 and MHCII expression (Dursun et al., 2016; Schlitzer et al., 2011; Schlitzer et al., 2012). These include a second population of cycling pre-pDCs (CCR9−MHCII−), referred to here as pre-pDC (B), immature pDCs (CCR9+MHCII−), and mature pDCs (CCR9+MHCII+; Fig. 7, B and C).
We analyzed Fucci2 MYCL-GFP mice following the progression of pDC development and maturation: ALP, pre-pDC (A), pre-pDC (B), immature pDC, and mature pDC (Fig. 7, D–F). All three progenitor populations were highly mitotic, with M phase frequency of ∼20% (Fig. 7, D–F). M phase frequency was reduced to ∼7% upon the transition from pre-pDCs to immature pDCs, and reduced to ∼0.6% in mature pDCs (Fig. 7, D–F). Notably, cell cycle exit was marked by a striking increase in CDT levels and loss of Geminin-expressing cells, indicating entry into G0 (Fig. 7 D). Low levels of Mycl-GFP were observed in ALPs, with a marked increase on transition to pre-pDC (A) and pre-pDC (B), which expressed a similar magnitude of Mycl-GFP. High levels of Mycl-GFP were observed in immature pDCs and reached a maximum in mature pDCs, which correlated with uniform CDT-mCherry expression, and thus cell cycle exit (Fig. 7, G and H). A similar trajectory analysis of cDC1 development (Bagadia et al., 2019b; Durai et al., 2019; Grajales-Reyes et al., 2015) examined Mycl-GFP from the MDP, CDP, early pre-cDC1 (CD115+), late pre-cDC1 (CD115−), and immature cDC1 in the BM (Fig. S5). Mycl-GFP was first induced on transition from CDPs to early pre-cDC1s, and increased progressively as M phase was gradually reduced in immature cDC1s (Fig. S5, A–D). These analyses demonstrate that MYCL is expressed most highly in terminal stages of DC development, which correlate with reduced cycling or complete exit from the cell cycle. Notably, we recently showed cDC expression of Mycl is eventually repressed when maturation in peripheral lymphoid organs occurs (Anderson et al., 2020b).
Discussion
This study identified the basis for DC-specific Mycl expression being the high levels of IRF8 expression common to cDC1 and pDCs. IRF8 is expressed in BM progenitors of DCs that express Myc and not Mycl. It is not until the specification of pre-cDC1 and pre-pDCs that IRF8 is expressed at levels sufficient for Mycl induction. We recently described the basis for the sensitivity of DC-specific enhancers to varying IRF4 and IRF8 levels (Kim et al., 2020). Enhancers of DC-specific genes contain EICEs and AICEs (Ciofani et al., 2012; Eisenbeis et al., 1995; Glasmacher et al., 2012; Li et al., 2012). IRF8 interacts with PU.1 at EICEs, and interacts with BATF3 at AICEs. Genes common to cDC1 and cDC2 rely on EICEs with high affinity for IRF4 and IRF8, while enhancers for cDC1-specific genes also rely on AICEs that require higher amounts of IRF factors for occupancy. Further, Mycl expression required that IRF8 be capable of interacting with PU.1, since Irf8R294C mutant (Grajales-Reyes et al., 2015; Turcotte et al., 2004; Turcotte et al., 2005) was unable to support Mycl expression. Thus, although Mycl enhancers contain both AICEs and EICEs, it appears that EICEs may predominate in regulation. In addition, the higher level of IRF8 in cDC1 compared with cDC2 agrees with their higher level of Mycl expression. Mycl expression by cDC2s is independent of Irf8 but may be supported by IRF4, which is expressed highly relative to cDC1s. Further, while Mycl expression by cDCs was independent of the +41kb Irf8 enhancer, mature pDCs require this enhancer to express IRF8 at levels sufficient for the highest Mycl expression. In summary, induction of Mycl during DC development relies on achieving a threshold level of IRF8 specific to certain DC lineages, which occurs only during their specification from the CDP or CLP.
In contrast with Mycl, Myc expression undergoes repression during pre-cDC1 and pre-pDC specification. Like Mycl induction, Myc repression depends on Irf8 expression and occurs during pre-cDC1 or pre-pDC specification. However, the molecular basis for Myc repression is unclear. IRF8 functions as an activating transcription factor either in a complex with PU.1 at EICEs, or in complex with JUN–BATF complexes at AICEs. Thus, how IRF8 would directly induce transcriptional repression is unclear. Conceivably, some chromatin configuration induced by IRF8 could act to insulate the Myc enhancers from the promoter, leading to loss of Myc expression, although there is currently no evidence to support such a model. Alternatively, an indirect mechanism of Myc repression could be controlled by a yet undiscovered gene target of IRF8 that encodes a transcriptional repressor. Determining the mechanism of IRF8-dependent Myc repression will require additional investigation.
Our analysis shows that Myc and Mycl support DC function in different stages of the cell cycle. The utility of the Fucci2 reporter system for analyzing the cell cycle status of primary cells was recently illustrated for neutrophil development in vivo (Abe et al., 2013; Muench et al., 2020). Here we used this system to examine DC development, finding that Myc and Mycl are expressed in opposite cell cycle stages. We confirm the known restricted expression of Myc to proliferating lymphocytes and hematopoietic progenitor populations (Liu et al., 2007; Schlitzer et al., 2011; Schlitzer et al., 2012; Ardouin et al., 2016; Huang et al., 2008). In contrast, we show that Mycl is expressed most highly in terminal stages of DC development, and in cells that have exited the cell cycle. Such cells have short half-lives and limited proliferation (Liu et al., 2007; Schlitzer et al., 2011; Schlitzer et al., 2012; Ardouin et al., 2016), and yet at least for cDC1s, their function relies on the transcriptional activity conferred by Mycl (Anderson et al., 2020b; Kc et al., 2014). It has not been determined whether Myc and Mycl are functionally interchangeable, for example, through reciprocal genetic swapping in vivo. However, their coordinate regulation by IRF8 during DC lineage specification suggests a requirement for the maintenance of a MYC factor activity in these specific types of terminally differentiated, but nondividing, myeloid cells.
Materials and methods
Mice
Irf8−/− mice have been described previously and were generated by crossing Irf8f/f mice (B6(Cg)-Irf8tm1.1Hm/J; The Jackson Laboratory) with CMV-Cre mice (B6.C-Tg(CMV-cre)1Cgn/J; Feng et al., 2011). MyclGFP (B6.129S6(C)-Mycltm1.1Kmm/J; The Jackson Laboratory) and MycGFP (B6;129-Myctm1Slek/J; The Jackson Laboratory) mice were described previously (Huang et al., 2008; Kc et al., 2014). Irf8 +41kb enhancer mutant mice were described previously and are available from The Jackson Laboratory (C57BL/6-Irf8em2Kmm/J; Durai et al., 2019). Fucci 2 mice were derived from embryos generated as described previously (Abe et al., 2013). All mice were maintained on the C57BL/6J background and in a specific pathogen–free animal facility following institutional guidelines and protocols approved by the Animal Studies Committee at Washington University in St. Louis. Experiments were conducted with mice 8–12 wk of age.
Antibodies and flow cytometry
Cells were stained at 4°C in a PBS solution, referred to as magnetic-activated cell sorting (MACS) buffer, containing 0.5% BSA (wt/vol), 2 mM EDTA, and CD16/32 blocking antibody (2.4G2). The following antibodies were from BD: Brilliant Ultraviolet 395–anti-CD117 (clone 2B8; catalog no. 564011), PE-CF594–anti-CD135 (clone A2F10.1; catalog no. 562537), V500–anti-MHC-II (clone M5/114.15.2; catalog no. 742893), Super Bright 645–anti-MHC-II (clone M5/114.15.2; catalog no. 64–5321-82), Alexa Fluor 700–anti-Ly6C (clone AL-21; catalog no. 561237), Brilliant Ultraviolet 395–anti-CD127 (clone SB/199; catalog no. 612841), biotin–anti-CD19 (clone 1D3; catalog no. 553784), BV510–anti-CD45R (clone RA3-6B2; catalog no. 563103), and PE–anti-CD90.1 (clone OX-7; catalog no. 554898). The following antibodies were from eBioscience: PE/Cy7–anti-CD24 (clone M1/69; catalog no. 25–0242-82), PE–eFluor 710–anti-CD172a (clone P84; catalog no. 46–1721-82), PE–anti-Siglec-H (clone eBio-440c; catalog no. 12–0333-82), APC-eFluor 780–anti-CD11c (clone N418; catalog no. 47–0114-82), and eFluor 450–anti-Ly-6D (clone 49-H4; catalog no. 48–5978-80). The following antibodies were from Biolegend: Alexa Fluor 647–anti-CD11b (clone M1/70; catalog no. 101218), Brilliant Violet 711–anti-CD115 (clone AFS98; catalog no. 135515), APC–anti-CD226 (clone 10E5; catalog no. 128810), PE–anti-human CD4 (clone RPA-T4; catalog no. 300508), PerCP/Cy5.5–anti-CD90.1 (clone OX-7; catalog no. 202527), PE/Cy7–anti-CD199 (clone CW-1.2; catalog no. 128711), biotin–anti-NK1.1 (clone PK136; catalog no. 108704), biotin–anti-CD3ε (clone 145-2C11; catalog no. 100304), biotin–anti-Ly-6G (clone 1A8; catalog no. 127604), and biotin–anti-TER119 (catalog no. 116204). Lineage depletion was performed using streptavidin MojoSort Nanobeads (Biolegend). Cell sorting and flow cytometry analysis were performed on a FACSCanto II (BD), FACSAria Fusion (BD), or Cytek Aurora (Cytek). Analysis was performed FlowJo software (BD).
Cell isolation and culture
BM was isolated from the pelvis, tibia, and femurs by centrifugation. Isolation of DCs from spleens was performed by digestion at 37°C with gentle agitation in complete IMDM containing 10% fetal calf serum (10%), supplemented with 30 U/ml DNase I (Sigma-Aldrich) and 250 µg/ml collagenase B (Roche). Cells were strained through a 70-µm filter, suspended, and stained in MACS buffer, following red cell lysis in an ammonium chloride–potassium bicarbonate lysis buffer. Populations analyzed in this study were defined as follows: cMoP (Lin−CD11c−MHCII−CD117+CD135−CD115+Ly6C+CD11b−), BM monocyte (Lin−CD11c−MHCII−CD117+CD135−CD115+Ly6C+CD11b+), MDP (Lin−CD11c−MHCII−CD117highCD135+CD115+), CDP (Lin−CD11c−MHCII−CD117intCD135+CD115+), CLP (Lin−CD11c−MHCII−CD127+CD135+CD115−Ly6C−), ALP (Lin−CD11c−MHCII−CD127+CD135+CD115−Ly6C− Ly6D−SiglecH−), BLP (Lin−CD11c−MHCII−CD127+CD135+CD115−Ly6C−Ly6D+SiglecH−), pre-pDC (A) (Lin−CD11c−MHCII−CD127+CD135+CD115−Ly6C−Ly6D+SiglecH+), pre-pDC (B) (Lin−CD11c+CD135+ Ly6D+SiglecH+CCR9−MHCII−), immature BM pDC (Lin−CD11c+CD135+Ly6D+SiglecH+CCR9+MHCII−), mature BM pDC (Lin−CD11c+CD135+Ly6D+SiglecH+CCR9+MHCII+), pre-cDC1-early (Lin−CD11c−MHCII−CD117intCD135+CD115+CD226+), pre-cDC1-late (Lin−CD11c+MHCIIintCD117intCD135+CD115−CD226+), pre-cDC2 (Lin−CD11c+MHCII−Ly6D−SiglecH−CD117lowCD135+CD115+Ly6C+), splenic or cultured pDC (Lin−B220+SiglecH+ or Lin−Ly6D+SiglecH+), splenic or cultured cDC1 (Lin−Ly6D−SiglecH−CD11c+MHCII+CD24+CD172a−), and splenic or cultured cDC2 (Lin−B220−CD11c+MHCII+CD172a+). Lineage antibodies included CD3, CD19, TER119, NK1.1, and Ly6G. For culture of sorted BM cells, cells were washed with complete IMDM supplemented with 100 ng/ml Flt3L (PeproTech) and incubated at 37°C and 5% CO2 for 6 d. Cells isolated for microarray analysis were sorted into MACS buffer at 4°C, pelleted by centrifugation, and lysed for RNA extraction, as described below.
Expression microarray analysis and ChIP-seq
RNA was column-extracted and treated with DNase I using the RNAqueous-Micro Kit (Ambion). Total RNA was submitted for expression microarray analysis to the Genome Technology Access Center at Washington University in St. Louis. mRNA was amplified with the Ovation Pico WT System (NuGEN) and hybridized to the GeneChip Mouse Gene 1.0 ST microarray (Affymetrix). Raw data were normalized by robust multiarray summarization and quantile-normalized. Differentially expressed genes were categorized into functional groups based on gene ontology annotations using the web-based Gene Set Analysis Toolkit (WebGestalt; Wang et al., 2017). Heat maps were generated using Morpheus (https://software.broadinstitute.org/morpheus). ChIP-seq data used in this study were generated in previous studies (GSE66899, GSE57563, and GSE174011) and processed as previously reported (Grajales-Reyes et al., 2015; Kim et al., 2020; Lin et al., 2015). AICE and EICE motifs were identified with the Find Individual Motif Occurrences motif identification program (Bailey et al., 2009). Expression microarray analyses of Irf4−/−Irf8−/− BM-derived cDCs were previously published, and data are publicly available (GSE140451; Kim et al., 2020).
Retroviral analysis
Plasmids for T2a-Thy.1 and IRES-hCD4 were generated by overlapping PCR product and cloned into the murine stem cell virus retroviral backbone. PCR products containing Irf8, Batf3, and Irf8R294C were cloned in frame with the respective vector. Retroviral plasmids were transfected into Platinum-E retroviral packaging cells together with TransIT-LT1 (Mirus Bio) and incubated overnight in Opti-MEM (Thermo Fisher Scientific) reduced serum media, after which the culture media were changed. Retrovirus was collected from the supernatant after 24 h. Lin− BM cells were transduced with the retrovirus in the presence of 2 µg/ml polybrene by spinoculation at 729 ×g for 1 h. Media were changed after 24 h of infection, and cells were cultured in vitro with Flt3L as described above.
Statistical analysis
Statistical analyses were performed with Prism (GraphPad Software). All sample groups passed a normality test and showed no statistical difference in their variance.
Accession codes
Expression microarray data were deposited in GEO under accession no. GSE176508.
Online supplemental material
Fig. S1 shows Mycl-GFP expression in bulk BM, BM pDC, cMoP, monocyte, CDP, CLP, and pre-pDC populations. Fig. S2 shows MYC-GFP expression in MDP, CDP, pre-cDC1, pre-cDC2, pre-pDC, BM pDC, and BLP populations. Fig. S3 identifies IRF8, IRF4, BATF3, and PU.1 binding sites, and Hypergeometric Optimization of Motif EnRichment motif analysis results for the indicated chromosomal regions surrounding the Mycl locus. Fig. S4 summarizes expression microarray analysis of Irf8 WT and KO splenic pDCs, and in vivo cell cycle analysis by Ki-67 intracellular staining. Fig. S5 analyzes Fucci2 cell cycle status along the trajectory of cDC1 development in the BM.
Acknowledgments
We thank the Genome Technology Access Center in the Department of Genetics at the Washington University School of Medicine for help with genomic analysis. The center is partially supported by the National Cancer Institute’s Cancer Center Support grant no. P30 CA91842 to the Siteman Cancer Center and by the National Center for Research Resources Institute of Clinical and Translational Sciences/Clinical and Translational Science Award grant no. UL1TR000448, a component of the National Institutes of Health and National Institutes of Health Roadmap for Medical Research. This publication is solely the responsibility of the authors and does not necessarily represent the official view of the National Center for Research Resources or National Institutes of Health. This work was supported by the National Institutes of Health (grant no. R01AI150297 to K.M. Murphy), the National Science Foundation (grant no. DGE-1143954 to D.A. Anderson), and the National Cancer Institute of the National Institutes of Health (grant nos. F31 CA228240 and T32 CA9547-35 to D.A. Anderson).
Author contributions: D.A. Anderson, T.L. Murphy, and K.M. Murphy designed the study and wrote the manuscript. D.A. Anderson performed all experiments, and F. Ou designed and conducted experiments pertaining to retroviral plasmid cloning, infection, and analysis. S. Kim performed expression microarray experiments and analysis.
References
- Abe, T., Sakaue-Sawano A., Kiyonari H., Shioi G., Inoue K., Horiuchi T., Nakao K., Miyawaki A., Aizawa S., and Fujimori T.. 2013. Visualization of cell cycle in mouse embryos with Fucci2 reporter directed by Rosa26 promoter. Development. 140:237–246. 10.1242/dev.084111 [DOI] [PubMed] [Google Scholar]
- Aliberti, J., Schulz O., Pennington D.J., Tsujimura H., Reis e Sousa C., Ozato K., and Sher A.. 2003. Essential role for ICSBP in the in vivo development of murine CD8alpha + dendritic cells. Blood. 101:305–310. 10.1182/blood-2002-04-1088 [DOI] [PubMed] [Google Scholar]
- Anderson, D.A. III, Dutertre C.A., Ginhoux F., and Murphy K.M.. 2020a. Genetic models of human and mouse dendritic cell development and function. Nat. Rev. Immunol. [DOI] [PMC free article] [PubMed] [Google Scholar]
- Anderson, D.A. III, Murphy T.L., Eisenman R.N., and Murphy K.M.. 2020b. The MYCL and MXD1 transcription factors regulate the fitness of murine dendritic cells. Proc. Natl. Acad. Sci. USA. 117:4885–4893. 10.1073/pnas.1915060117 [DOI] [PMC free article] [PubMed] [Google Scholar]
- Ardouin, L., Luche H., Chelbi R., Carpentier S., Shawket A., Montanana Sanchis F., Santa Maria C., Grenot P., Alexandre Y., Grégoire C., et al. 2016. Broad and Largely Concordant Molecular Changes Characterize Tolerogenic and Immunogenic Dendritic Cell Maturation in Thymus and Periphery. Immunity. 45:305–318. 10.1016/j.immuni.2016.07.019 [DOI] [PubMed] [Google Scholar]
- Bagadia, P., Huang X., Liu T.T., Durai V., Grajales-Reyes G.E., Nitschké M., Modrusan Z., Granja J.M., Satpathy A.T., Briseño C.G., et al. 2019a. An Nfil3-Zeb2-Id2 pathway imposes Irf8 enhancer switching during cDC1 development. Nat. Immunol. 20:1174–1185. 10.1038/s41590-019-0449-3 [DOI] [PMC free article] [PubMed] [Google Scholar]
- Bagadia, P., Huang X., Liu T.T., and Murphy K.M.. 2019b. Shared Transcriptional Control of Innate Lymphoid Cell and Dendritic Cell Development. Annu. Rev. Cell Dev. Biol. 35:381–406. 10.1146/annurev-cellbio-100818-125403 [DOI] [PMC free article] [PubMed] [Google Scholar]
- Bahr, C., von Paleske L., Uslu V.V., Remeseiro S., Takayama N., Ng S.W., Murison A., Langenfeld K., Petretich M., Scognamiglio R., et al. 2018. A Myc enhancer cluster regulates normal and leukaemic haematopoietic stem cell hierarchies. Nature. 553:515–520. 10.1038/nature25193 [DOI] [PubMed] [Google Scholar]
- Bailey, T.L., Boden M., Buske F.A., Frith M., Grant C.E., Clementi L., Ren J., Li W.W., and Noble W.S.. 2009. MEME SUITE: tools for motif discovery and searching. Nucleic Acids Res. 37(Web Server issue, web server):W202–W208. 10.1093/nar/gkp335 [DOI] [PMC free article] [PubMed] [Google Scholar]
- Ciofani, M., Madar A., Galan C., Sellars M., Mace K., Pauli F., Agarwal A., Huang W., Parkhurst C.N., Muratet M., et al. 2012. A validated regulatory network for Th17 cell specification. Cell. 151:289–303. 10.1016/j.cell.2012.09.016 [DOI] [PMC free article] [PubMed] [Google Scholar]
- Dress, R.J., Dutertre C.A., Giladi A., Schlitzer A., Low I., Shadan N.B., Tay A., Lum J., Kairi M.F.B.M., Hwang Y.Y., et al. 2019. Plasmacytoid dendritic cells develop from Ly6D+ lymphoid progenitors distinct from the myeloid lineage. Nat. Immunol. 20:852–864. 10.1038/s41590-019-0420-3 [DOI] [PubMed] [Google Scholar]
- Durai, V., Bagadia P., Granja J.M., Satpathy A.T., Kulkarni D.H., Davidson J.T. IV, Wu R., Patel S.J., Iwata A., Liu T.T., et al. 2019. Cryptic activation of an Irf8 enhancer governs cDC1 fate specification. Nat. Immunol. 20:1161–1173. 10.1038/s41590-019-0450-x [DOI] [PMC free article] [PubMed] [Google Scholar]
- Dursun, E., Endele M., Musumeci A., Failmezger H., Wang S.H., Tresch A., Schroeder T., and Krug A.B.. 2016. Continuous single cell imaging reveals sequential steps of plasmacytoid dendritic cell development from common dendritic cell progenitors. Sci. Rep. 6:37462. 10.1038/srep37462 [DOI] [PMC free article] [PubMed] [Google Scholar]
- Eisenbeis, C.F., Singh H., and Storb U.. 1995. Pip, a novel IRF family member, is a lymphoid-specific, PU.1-dependent transcriptional activator. Genes Dev. 9:1377–1387. 10.1101/gad.9.11.1377 [DOI] [PubMed] [Google Scholar]
- Feng, J., Wang H., Shin D.M., Masiuk M., Qi C.F., and Morse H.C. III. 2011. IFN regulatory factor 8 restricts the size of the marginal zone and follicular B cell pools. J. Immunol. 186:1458–1466. 10.4049/jimmunol.1001950 [DOI] [PMC free article] [PubMed] [Google Scholar]
- Fogg, D.K., Sibon C., Miled C., Jung S., Aucouturier P., Littman D.R., Cumano A., and Geissmann F.. 2006. A clonogenic bone marrow progenitor specific for macrophages and dendritic cells. Science. 311:83–87. 10.1126/science.1117729 [DOI] [PubMed] [Google Scholar]
- Glasmacher, E., Agrawal S., Chang A.B., Murphy T.L., Zeng W., Vander Lugt B., Khan A.A., Ciofani M., Spooner C.J., Rutz S., et al. 2012. A genomic regulatory element that directs assembly and function of immune-specific AP-1-IRF complexes. Science. 338:975–980. 10.1126/science.1228309 [DOI] [PMC free article] [PubMed] [Google Scholar]
- Grajales-Reyes, G.E., Iwata A., Albring J., Wu X., Tussiwand R., Kc W., Kretzer N.M., Briseño C.G., Durai V., Bagadia P., et al. 2015. Batf3 maintains autoactivation of Irf8 for commitment of a CD8α(+) conventional DC clonogenic progenitor. Nat. Immunol. 16:708–717. 10.1038/ni.3197 [DOI] [PMC free article] [PubMed] [Google Scholar]
- Hartl, M., Mitterstiller A.M., Valovka T., Breuker K., Hobmayer B., and Bister K.. 2010. Stem cell-specific activation of an ancestral myc protooncogene with conserved basic functions in the early metazoan Hydra. Proc. Natl. Acad. Sci. USA. 107:4051–4056. 10.1073/pnas.0911060107 [DOI] [PMC free article] [PubMed] [Google Scholar]
- Huang, C.Y., Bredemeyer A.L., Walker L.M., Bassing C.H., and Sleckman B.P.. 2008. Dynamic regulation of c-Myc proto-oncogene expression during lymphocyte development revealed by a GFP-c-Myc knock-in mouse. Eur. J. Immunol. 38:342–349. 10.1002/eji.200737972 [DOI] [PubMed] [Google Scholar]
- Inlay, M.A., Bhattacharya D., Sahoo D., Serwold T., Seita J., Karsunky H., Plevritis S.K., Dill D.L., and Weissman I.L.. 2009. Ly6d marks the earliest stage of B-cell specification and identifies the branchpoint between B-cell and T-cell development. Genes Dev. 23:2376–2381. 10.1101/gad.1836009 [DOI] [PMC free article] [PubMed] [Google Scholar]
- Johnston, L.A., Prober D.A., Edgar B.A., Eisenman R.N., and Gallant P.. 1999. Drosophila myc regulates cellular growth during development. Cell. 98:779–790. 10.1016/S0092-8674(00)81512-3 [DOI] [PMC free article] [PubMed] [Google Scholar]
- Kc, W., Satpathy A.T., Rapaport A.S., Briseño C.G., Wu X., Albring J.C., Russler-Germain E.V., Kretzer N.M., Durai V., Persaud S.P., et al. 2014. L-Myc expression by dendritic cells is required for optimal T-cell priming. Nature. 507:243–247. 10.1038/nature12967 [DOI] [PMC free article] [PubMed] [Google Scholar]
- Kim, S., Bagadia P., Anderson D.A. III, Liu T.T., Huang X., Theisen D.J., O’Connor K.W., Ohara R.A., Iwata A., Murphy T.L., and Murphy K.M.. 2020. High Amount of Transcription Factor IRF8 Engages AP1-IRF Composite Elements in Enhancers to Direct Type 1 Conventional Dendritic Cell Identity. Immunity. 53:759–774.e9. 10.1016/j.immuni.2020.07.018 [DOI] [PMC free article] [PubMed] [Google Scholar]
- King, B., Boccalatte F., Moran-Crusio K., Wolf E., Wang J., Kayembe C., Lazaris C., Yu X., Aranda-Orgilles B., Lasorella A., and Aifantis I.. 2016. The ubiquitin ligase Huwe1 regulates the maintenance and lymphoid commitment of hematopoietic stem cells. Nat. Immunol. 17:1312–1321. 10.1038/ni.3559 [DOI] [PMC free article] [PubMed] [Google Scholar]
- Kondo, M., Weissman I.L., and Akashi K.. 1997. Identification of clonogenic common lymphoid progenitors in mouse bone marrow. Cell. 91:661–672. 10.1016/S0092-8674(00)80453-5 [DOI] [PubMed] [Google Scholar]
- Laurenti, E., Varnum-Finney B., Wilson A., Ferrero I., Blanco-Bose W.E., Ehninger A., Knoepfler P.S., Cheng P.F., MacDonald H.R., Eisenman R.N., et al. 2008. Hematopoietic stem cell function and survival depend on c-Myc and N-Myc activity. Cell Stem Cell. 3:611–624. 10.1016/j.stem.2008.09.005 [DOI] [PMC free article] [PubMed] [Google Scholar]
- Li, P., Spolski R., Liao W., Wang L., Murphy T.L., Murphy K.M., and Leonard W.J.. 2012. BATF-JUN is critical for IRF4-mediated transcription in T cells. Nature. 490:543–546. 10.1038/nature11530 [DOI] [PMC free article] [PubMed] [Google Scholar]
- Lin, Q., Chauvistré H., Costa I.G., Gusmao E.G., Mitzka S., Hänzelmann S., Baying B., Klisch T., Moriggl R., Hennuy B., et al. 2015. Epigenetic program and transcription factor circuitry of dendritic cell development. Nucleic Acids Res. 43:9680–9693. 10.1093/nar/gkv1056 [DOI] [PMC free article] [PubMed] [Google Scholar]
- Liu, K., Waskow C., Liu X., Yao K., Hoh J., and Nussenzweig M.. 2007. Origin of dendritic cells in peripheral lymphoid organs of mice. Nat. Immunol. 8:578–583. 10.1038/ni1462 [DOI] [PubMed] [Google Scholar]
- Liu, Z., Gu Y., Chakarov S., Bleriot C., Kwok I., Chen X., Shin A., Huang W., Dress R.J., Dutertre C.A., et al. 2019. Fate Mapping via Ms4a3-Expression History Traces Monocyte-Derived Cells. Cell. 178:1509–1525.e19. 10.1016/j.cell.2019.08.009 [DOI] [PubMed] [Google Scholar]
- Manz, M.G., Traver D., Miyamoto T., Weissman I.L., and Akashi K.. 2001. Dendritic cell potentials of early lymphoid and myeloid progenitors. Blood. 97:3333–3341. 10.1182/blood.V97.11.3333 [DOI] [PubMed] [Google Scholar]
- Muench, D.E., Olsson A., Ferchen K., Pham G., Serafin R.A., Chutipongtanate S., Dwivedi P., Song B., Hay S., Chetal K., et al. 2020. Mouse models of neutropenia reveal progenitor-stage-specific defects. Nature. 582:109–114. 10.1038/s41586-020-2227-7 [DOI] [PMC free article] [PubMed] [Google Scholar]
- Naik, S.H., Sathe P., Park H.Y., Metcalf D., Proietto A.I., Dakic A., Carotta S., O’Keeffe M., Bahlo M., Papenfuss A., et al. 2007. Development of plasmacytoid and conventional dendritic cell subtypes from single precursor cells derived in vitro and in vivo. Nat. Immunol. 8:1217–1226. 10.1038/ni1522 [DOI] [PubMed] [Google Scholar]
- Onai, N., Obata-Onai A., Schmid M.A., Ohteki T., Jarrossay D., and Manz M.G.. 2007. Identification of clonogenic common Flt3+M-CSFR+ plasmacytoid and conventional dendritic cell progenitors in mouse bone marrow. Nat. Immunol. 8:1207–1216. 10.1038/ni1518 [DOI] [PubMed] [Google Scholar]
- Reavie, L., Della Gatta G., Crusio K., Aranda-Orgilles B., Buckley S.M., Thompson B., Lee E., Gao J., Bredemeyer A.L., Helmink B.A., et al. 2010. Regulation of hematopoietic stem cell differentiation by a single ubiquitin ligase-substrate complex. Nat. Immunol. 11:207–215. 10.1038/ni.1839 [DOI] [PMC free article] [PubMed] [Google Scholar]
- Rodrigues, P.F., Alberti-Servera L., Eremin A., Grajales-Reyes G.E., Ivanek R., and Tussiwand R.. 2018. Distinct progenitor lineages contribute to the heterogeneity of plasmacytoid dendritic cells. Nat. Immunol. 19:711–722. 10.1038/s41590-018-0136-9 [DOI] [PMC free article] [PubMed] [Google Scholar]
- Sathe, P., Vremec D., Wu L., Corcoran L., and Shortman K.. 2013. Convergent differentiation: myeloid and lymphoid pathways to murine plasmacytoid dendritic cells. Blood. 121:11–19. 10.1182/blood-2012-02-413336 [DOI] [PubMed] [Google Scholar]
- Sathe, P., Metcalf D., Vremec D., Naik S.H., Langdon W.Y., Huntington N.D., Wu L., and Shortman K.. 2014. Lymphoid tissue and plasmacytoid dendritic cells and macrophages do not share a common macrophage-dendritic cell-restricted progenitor. Immunity. 41:104–115. 10.1016/j.immuni.2014.05.020 [DOI] [PubMed] [Google Scholar]
- Schiavoni, G., Mattei F., Sestili P., Borghi P., Venditti M., Morse H.C. III, Belardelli F., and Gabriele L.. 2002. ICSBP is essential for the development of mouse type I interferon-producing cells and for the generation and activation of CD8alpha(+) dendritic cells. J. Exp. Med. 196:1415–1425. 10.1084/jem.20021263 [DOI] [PMC free article] [PubMed] [Google Scholar]
- Schlenner, S.M., Madan V., Busch K., Tietz A., Läufle C., Costa C., Blum C., Fehling H.J., and Rodewald H.R.. 2010. Fate mapping reveals separate origins of T cells and myeloid lineages in the thymus. Immunity. 32:426–436. 10.1016/j.immuni.2010.03.005 [DOI] [PubMed] [Google Scholar]
- Schlitzer, A., Loschko J., Mair K., Vogelmann R., Henkel L., Einwächter H., Schiemann M., Niess J.H., Reindl W., and Krug A.. 2011. Identification of CCR9- murine plasmacytoid DC precursors with plasticity to differentiate into conventional DCs. Blood. 117:6562–6570. 10.1182/blood-2010-12-326678 [DOI] [PubMed] [Google Scholar]
- Schlitzer, A., Heiseke A.F., Einwächter H., Reindl W., Schiemann M., Manta C.P., See P., Niess J.H., Suter T., Ginhoux F., and Krug A.B.. 2012. Tissue-specific differentiation of a circulating CCR9- pDC-like common dendritic cell precursor. Blood. 119:6063–6071. 10.1182/blood-2012-03-418400 [DOI] [PubMed] [Google Scholar]
- Schlitzer, A., Sivakamasundari V., Chen J., Sumatoh H.R., Schreuder J., Lum J., Malleret B., Zhang S., Larbi A., Zolezzi F., et al. 2015. Identification of cDC1- and cDC2-committed DC progenitors reveals early lineage priming at the common DC progenitor stage in the bone marrow. Nat. Immunol. 16:718–728. 10.1038/ni.3200 [DOI] [PubMed] [Google Scholar]
- Shigematsu, H., Reizis B., Iwasaki H., Mizuno S., Hu D., Traver D., Leder P., Sakaguchi N., and Akashi K.. 2004. Plasmacytoid dendritic cells activate lymphoid-specific genetic programs irrespective of their cellular origin. Immunity. 21:43–53. 10.1016/j.immuni.2004.06.011 [DOI] [PubMed] [Google Scholar]
- Sichien, D., Scott C.L., Martens L., Vanderkerken M., Van Gassen S., Plantinga M., Joeris T., De Prijck S., Vanhoutte L., Vanheerswynghels M., et al. 2016. IRF8 Transcription Factor Controls Survival and Function of Terminally Differentiated Conventional and Plasmacytoid Dendritic Cells, Respectively. Immunity. 45:626–640. 10.1016/j.immuni.2016.08.013 [DOI] [PubMed] [Google Scholar]
- Turcotte, K., Gauthier S., Mitsos L.M., Shustik C., Copeland N.G., Jenkins N.A., Fournet J.C., Jolicoeur P., and Gros P.. 2004. Genetic control of myeloproliferation in BXH-2 mice. Blood. 103:2343–2350. 10.1182/blood-2003-06-1852 [DOI] [PubMed] [Google Scholar]
- Turcotte, K., Gauthier S., Tuite A., Mullick A., Malo D., and Gros P.. 2005. A mutation in the Icsbp1 gene causes susceptibility to infection and a chronic myeloid leukemia-like syndrome in BXH-2 mice. J. Exp. Med. 201:881–890. 10.1084/jem.20042170 [DOI] [PMC free article] [PubMed] [Google Scholar]
- Wang, J., Vasaikar S., Shi Z., Greer M., and Zhang B.. 2017. WebGestalt 2017: a more comprehensive, powerful, flexible and interactive gene set enrichment analysis toolkit. Nucleic Acids Res. 45(W1):W130–W137. 10.1093/nar/gkx356 [DOI] [PMC free article] [PubMed] [Google Scholar]
- Wu, L., D’Amico A., Hochrein H., O’Keeffe M., Shortman K., and Lucas K.. 2001. Development of thymic and splenic dendritic cell populations from different hemopoietic precursors. Blood. 98:3376–3382. 10.1182/blood.V98.12.3376 [DOI] [PubMed] [Google Scholar]
- Young, S.L., Diolaiti D., Conacci-Sorrell M., Ruiz-Trillo I., Eisenman R.N., and King N.. 2011. Premetazoan ancestry of the Myc-Max network. Mol. Biol. Evol. 28:2961–2971. 10.1093/molbev/msr132 [DOI] [PMC free article] [PubMed] [Google Scholar]
- Zielke, N., and Edgar B.A.. 2015. FUCCI sensors: powerful new tools for analysis of cell proliferation. Wiley Interdiscip. Rev. Dev. Biol. 4:469–487. 10.1002/wdev.189 [DOI] [PMC free article] [PubMed] [Google Scholar]


