Abstract
Background
Taste is fundamental to diet selection in vertebrates. Genetic basis of sweet taste receptor in the shaping of food habits has been extensively studied in mammals and birds, but scarcely studied in fishes. Grass carp is an excellent model for studying vegetarian adaptation, as it exhibits food habit transition from carnivory to herbivory.
Results
We identified six sweet taste receptors (gcT1R2A-F) in grass carp. The four gcT1R2s (gcT1R2C-F) have been suggested to be evolved from and paralogous to the two original gcT1R2s (gcT1R2A and gcT1R2B). All gcT1R2s were expressed in taste organs and mediated glucose-, fructose- or arginine-induced intracellular calcium signaling, revealing they were functional. In addition, grass carp was performed to prefer fructose to glucose under a behavioral experiment. Parallelly, compared with gcT1R2A-F/gcT1R3 co-transfected cells, gcT1R2C-F/gcT1R3 co-transfected cells showed a higher response to plant-specific fructose. Moreover, food habit transition from carnivory to herbivory in grass carp was accompanied by increased gene expression of certain gcT1R2s.
Conclusions
We suggested that the gene expansion of T1R2s in grass carp was an adaptive strategy to accommodate the change in food environment. Moreover, the selected gene expression of gcT1R2s might drive the food habit transition from carnivory to herbivory in grass carp. This study provided some evolutional and physiological clues for the formation of herbivory in grass carp.
Keywords: Taste receptor, Gene expansion, Adaptive evolution, Food habit transition, Herbivory
Background
Taste perception, conveying important dietary information, is fundamental for the survival of animals ranging from insects to mammals [1, 2]. All tastes are combinations of five basic modalities: sweet, umami, bitter, salty, and sour [3, 4]. Sensory systems display remarkable flexibility across vertebrates, with some abandoning unnecessary sensory modalities [5–7] while others evolving new adaptive sensory modalities [8]. In vertebrates, sweet and umami tastes are identified by a class of G protein-coupled receptors (GPCRs) termed taste receptor type 1 (T1R) [2]. Most vertebrates have three T1Rs, with the T1R1-T1R3 heterodimer mediating umami taste and the T1R2-T1R3 heterodimer mediating sweet taste [2, 9].
Taste perception varies enormously across different lineages and species of vertebrates [1, 2]. Sweet taste “blindness” observed in some carnivorous mammals, such as domestic cat, California sea lion, southern fur seal, Pacific harbor seal, Asian small-clawed otter, spotted hyena, fossa, banded linsang, bottlenose dolphin, and vampire bats, have been suggested to be the consequence of pseudogenization of T1R2 since they do not require the receptor for sweet food perception [6, 7, 10, 11]. However, almost all omnivorous and herbivorous mammals with the habit to consume sugars have a functional T1R2 structure [6, 7, 10, 12–15]. Unlike pseudogenization of T1R2 in some carnivorous mammals, the evolution of sweet taste in birds is in absence of T1R2 despite food habits [16–18]. Nevertheless, ancestral umami taste receptor has been repurposed to detect sweet in the hummingbird [17]. The absence or presence of intact T1R2 is concordant with food habits in mammals and birds, suggesting the adaption of T1R2 evolution to food habit formation and environmental change.
Teleost fishes represent about half of all living vertebrate species and provide important models for evolutionary study [19]. The food habits of fish, which are more sensitive to water-soluble chemicals than mammals, are demonstrated to be associated with chemosensory-mediated taste sense [20, 21]. Unlike pseudogenization or absence in mammals or birds, most fish have been shown to possess two or three T1R2s [16, 22, 23]. Whether the gene number of fish T1R2 genes related to the formation of food habits like mammals or birds is worthy of further exploration [24].
Constituting a member of the Cyprinidae family, grass carp (Ctenopharyngodon idellus) is an excellent model for studying the formation mechanism of herbivory as it shows the food habit transition from carnivory to herbivory [25, 26]. Grass carp is carnivorous when its total length is shorter than 3 cm, then fish of 3–5.5 cm undergo the food transition stage from zooplankton or benthos to aquatic macrophytes, whereas fish larger than 5.5 cm is completely herbivorous [25–27]. We hypothesized T1R2 gene might be involved in food habit transition and adaptation to a vegetarian diet observed in grass carp. For this purpose, six grass carp T1R2s (gcT1R2s) were identified from draft genome sequences and their evolutionary analysis was conducted among fish with different food habits. When transfected in Human embryonic kidney 293 T (HEK293T) cells, gcT1R2/gcT1R3 responded to ubiquitous glucose and plant-specific fructose in intracellular calcium signaling. Gene expressions of T1R2s in grass carp before and after food transition from carnivory to herbivory were also investigated. This study might provide new insights into the adaptive evolution of sweet taste receptors during food habit formation in fish.
Results
Characterization of gcT1R2 genes
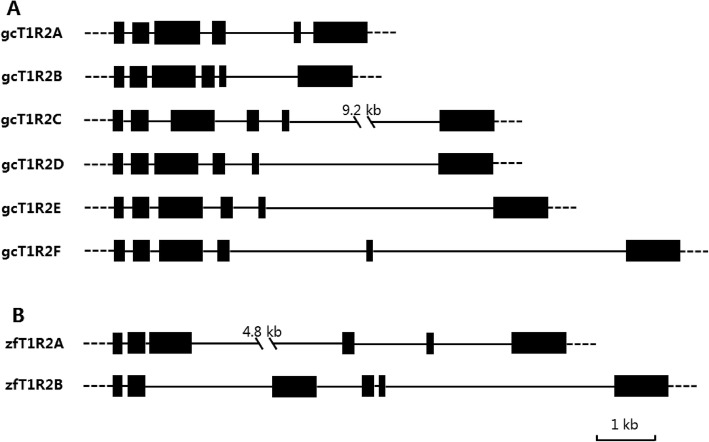
Conducting a homology search, we sequenced six T1R2 genes, named gcT1R2A-F, from the grass carp genome sequence (Genbank accession no. in Table 1 and detail information in electronic Additional file 1: Dataset S1). The six T1R2s of grass carp showed higher than 78% identities with each other, higher than 73% identities with two T1R2s of zebrafish, whereas lower than 35% identities with human T1R2 (electronic Additional file 5: Table S4). The genomic structure of all gcT1R2s consisted of six coding exons and five introns like zebrafish T1R2s (Fig. 1).
Table 1.
Numbers of sweet taste receptors and pseudogenes in fishes
| Order | Species | Food habits | Numbers of T1R2 | Accession no. |
|---|---|---|---|---|
| Coelacanthiformes | Coelacanth (Latimeria chalumnae) | Carnivore | 2 | |
| Lepidosteiformes | Spotted gar (Lepisosteus oculatus) | Carnivore | 2 | |
| Characiformes | Cavefish (Astyanax mexicanus) | Carnivore | 2 |
ENSAMXG00000014366 ENSAMXG00000014380 |
| Gasterosteiformes | Stickleback (Gasterosteus aculeatus) | Carnivore | 8 |
ENSGACG00000006506 ENSGACG00000006510 ENSGACG00000006517 ENSGACG00000006525 ENSGACG00000006529 ENSGACG00000006534 ENSGACG00000006536 ENSGACG00000006762 |
| Perciformes | European seabass (Dicentrarchus labrax) | Carnivore | 2 |
DLAgn_00132730 DLAgn_00132740 |
| Cyprinodontiformes | Guppy (Poecilia reticulata) | Omnivore | 2 | |
| Cyprinodontiformes | Southern platyfish (Xiphophorus maculatus) | Omnivore | 2 | |
| Beloniformes | Medaka (Oryzias latipes) | Omnivore | 3 | |
| Perciformes | Zebra mbuna (Maylandia zebra) | Omnivore | 2 | |
| Perciformes | Tilapia (Oreochromis niloticus) | Omnivore | 3 | |
| Tetraodontiformes | Fugu (Takifugu rubripes) | Omnivore | 2 | |
| Cypriniformes | Common carp (Cyprinus carpio) | Omnivore | 2 | |
| Cypriniformes | Zebrafish (Danio rerio) | Omnivore | 2 | |
| Cypriniformes | Blunt snout bream (Megalobrama amblycephala) | Herbivore | 3 | SRP090157 |
| Cypriniformes | Grass carp (Ctenopharyngodon idellus) | Herbivore | 6 |
Fig. 1.
The gene structures of T1R2 genes in grass carp (a) and zebrafish (b). The black lines indicate introns, and the black boxes indicate exons. The six gcT1R2 genes we obtained contained 6 exons and 5 introns as well as the genomic structure of two zebrafish T1R2 genes
Although several carnivorous and omnivorous fish species have two or three T1R2 genes, T1R2 genes have been highly duplicated in grass carp (Table 1). Moreover, among Cypriniformes, highly gene duplication of T1R2s could only be observed in herbivorous grass carp and blunt snout bream.
Evolutionary analyses of gcT1R2s
Synteny analysis showed that the gcT1R2 genes are located on linkage group 21 (Fig. 2). The adjacent genes of gcT1R2A and gcT1R2B were identical with those of zebrafish T1R2.1 and T1R2.2. Interestingly, the order of adjacent genes of gcT1R2C-F was also identical with the order of the same genes in zebrafish without any gene at the corresponding location. In addition, as the different color-marked gene groups shown in Fig. 2, gene translocation might be occurred among the four fished we selected.
Fig. 2.
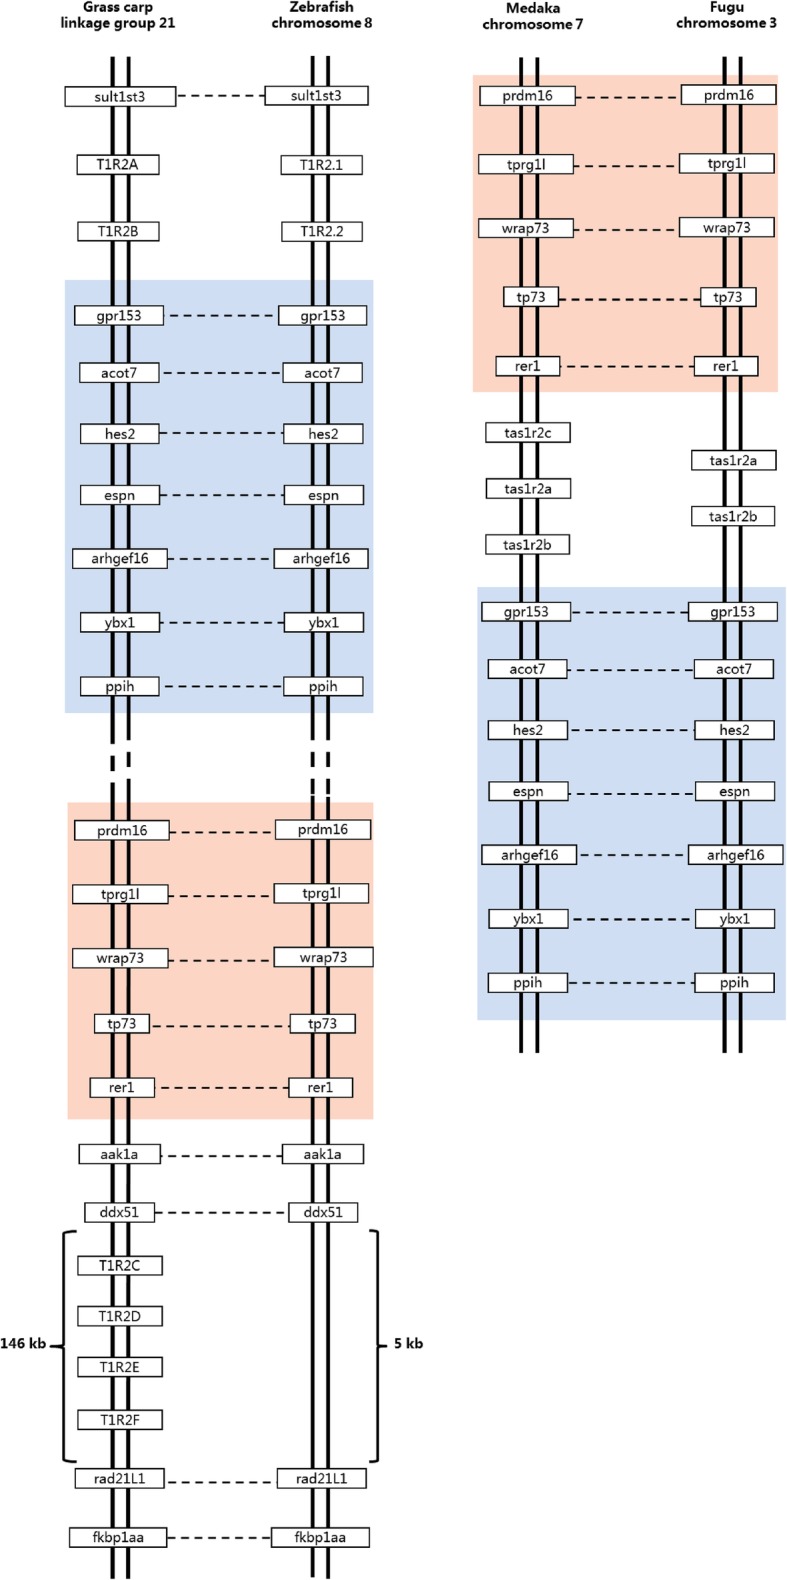
Synteny analysis of T1R2 genes. The synteny analysis performed by searching gene(s) flanking T1R2 in genomes of zebrafish, medaka and fugu using map viewer of NCBI. GenBank accession numbers of the adjacent genes of zebrafish T1R2.1 (NM_001039831.1) and T1R2.2 (NM_001083856.1) in the figure were as follows: sult1st3, NM_183348.2; gpr153, XM_009304261.1; acot7, NM001004617.1; hes2, NM_001045353.1; espn, NM_001123282.1; arhgef16, NM_001123283.1; ybx1, NM_001126457.1; ppih, NM_001009902.2; prdm16; XM_005167301.2; tprg1l, XM_001922766.5; wrap73, NM_199893.1; tp73, NM_183340.1; rer1, XM_005167299.2; aak1a, XM_005167316.2; ddx51, NM_001003864.1; rad 21 L1, NM_001080050.1; fkbp1aa, NM199945.1. GenBank accession numbers of the adjacent genes of medaka tas1r2a (NM_001104858.1), tas1r2b (NM_001104723.1) and tas1r2c (NM_001104724.1) in the figure were as follows: prdm16, XM_011476903.1; tprg1l, XM_004070640.2; wrap73, XM_004070359.2; tp73, XM_004070358.2; rer1, XM_011476898.1; gpr153, XM_011476896.1; acot7, XM_011476894.1; hes2, XM_004070354.2; espn, XM_011476893.1; arhgef16, XM_011476892.1; ybx1, NM_001104673.1; ppih, XM_004070353.2. GenBank accession numbers of the adjacent genes of fugu tas1r2a (NM_001105217.1) and tas1r2b (NM_001105218.1) in the figure were as follows: prdm16, XM_003963257.1; tprg1l, XM_003963136.1; wrap73, XM_003963258.1; tp73, XM_003963138.1; rer1, XM_003963139.1; gpr153, XM_003963260.1; acot7, XM_003963140.1; hes2, XM_003963261.1; espn, XM_003963263.1; arhgef16, XM_003963264.1; ybx1, XM_003963141.1; ppih, XM_003963144.1
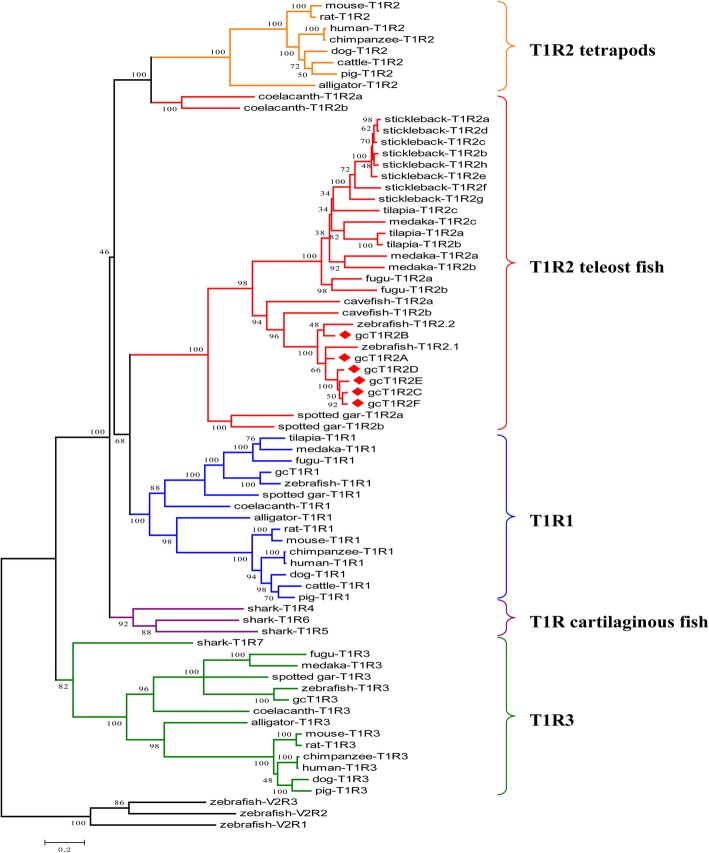
Phylogenetic analysis showed that all fish T1R2s and mammalian T1R2 formed two independent clusters except coelacanth (Fig. 3). The coelacanth T1R2s are more closely related to mammalian T1R2. The teleost T1R2s were more closely related to the tetrapod T1R1s than to the tetrapod T1R2s. In fishes, spotted gar (Lepisosteus oculatus) which belongs to Holostei formed an independent cluster. For Teleostei, Ostariophysi, containing zebrafish, cavefish (Astyanax mexicanus) and grass carp, and Acanthopterygii, containing medaka, fugu, stickleback (Gasterosteus aculeatus) and tilapia (Oreochromis niloticus) formed two independent clusters. Notably, gcT1R2A and zebrafish T1R2.1 formed one cluster as well as the gcT1R2C-F, gcT1R2B and zebrafish T1R2.2 formed another cluster.
Fig. 3.
Molecular phylogenetic analysis by maximum likelihood method of T1R2. The evolutionary history was inferred by using the Maximum Likelihood method based on the JTT matrix-based model. The tree with the highest log likelihood (− 39,600.8248) is shown. The percentage of trees in which the associated taxa clustered together is shown next to the branches. Initial tree(s) for the heuristic search were obtained automatically by applying Neighbor-Join and BioNJ algorithms to a matrix of pairwise distances estimated using a JTT model, and then selecting the topology with superior log likelihood value. A discrete Gamma distribution was used to model evolutionary rate differences among sites (5 categories (+G, parameter = 2.8034)). The rate variation model allowed for some sites to be evolutionarily invariable ([+I], 1.3917% sites). The tree is drawn to scale, with branch lengths measured in the number of substitutions per site. The analysis involved 73 amino acid sequences. All positions containing gaps and missing data were eliminated. There were a total of 503 positions in the final dataset. Evolutionary analysis was conducted in MEGA7. The T1R2s amino acid sequences of fishes and mammals used are given in the electronic Additional file 3: Table S2
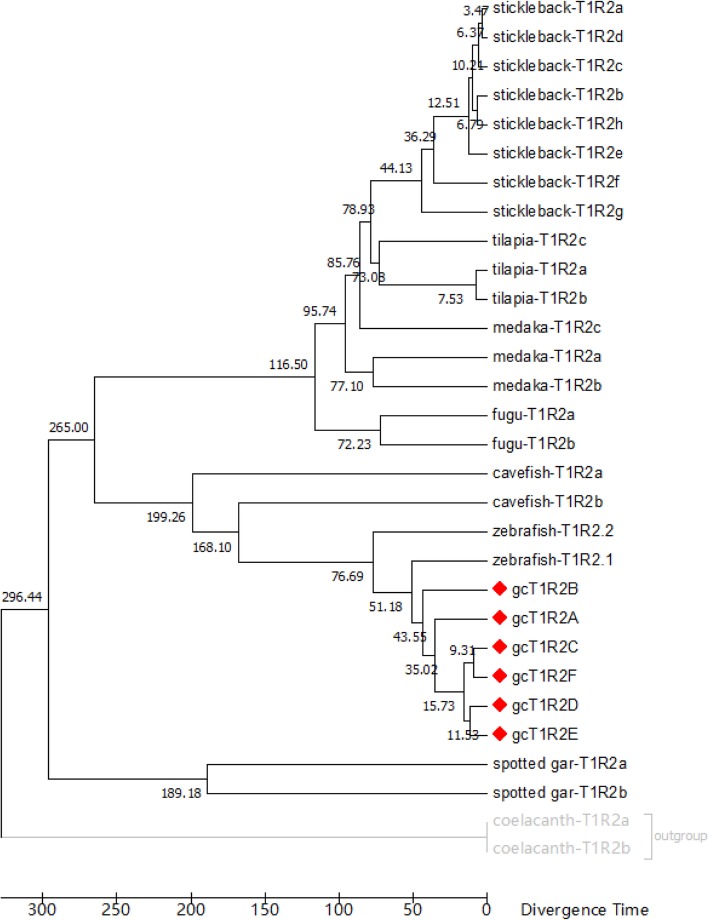
According to the TimeTree database, gcT1R2C-F were formed after the formation of gcT1R2A and gcT1R2B (Fig. 4). The estimated divergence time between the original formed two gcT1R2s and the new formed four gcT1R2s was around 34.7 million years ago.
Fig. 4.
A timetree inferred using the reltime method and the general time reversible model of fish T1R2 genes. The timetree was computed using 4 calibration constraints. The estimated log likelihood value is − 21,587.6247. A discrete Gamma distribution was used to model evolutionary rate differences among sites (5 categories (+G, parameter = 1.6461)). The rate variation model allowed for some sites to be evolutionarily invariable ([+I], 9.5713% sites). The analysis involved 30 nucleotide sequences. All positions containing gaps and missing data were eliminated. There were a total of 1353 positions in the final dataset. Evolutionary analysis was conducted in MEGA7. The T1R2s nucleotide sequences of fishes used are given in the electronic Additional file 4: Table S3
Tissue distributions of gcT1R2s
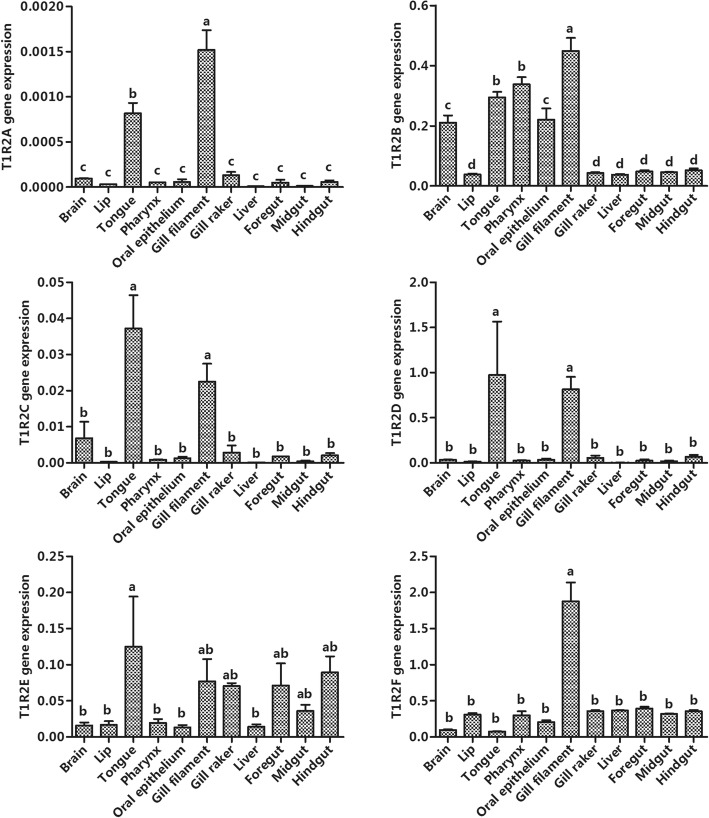
By using geNorm software, the gene with the most stable expression across the experimental conditions was EF1 (Additional file 6: Table S5). The mRNA tissue expression levels of gcT1R2s were analyzed by real-time PCR, using EF1 as an internal control (Fig. 5). The gene expression of gcT1R2A was the highest in gill filament and followed by tongue. The highest mRNA abundance of gcT1R2B was observed in gill filament, followed by tongue and pharynx, and the lower gene expressions were detected in brain and oral epithelium. gcT1R2C and gcT1R2D were prominently expressed in gill filament and tongue. The gene expression of gcT1R2E was the highest in tongue, and abundant in gill filament, gill raker, foregut, midgut, and hindgut. gcT1R2F was prominently expressed in the gill filament.
Fig. 5.
Tissue distributions of gcT1R2s. Relative mRNA expression was quantified using real-time PCR and normalized against EF1 as a housekeeping gene. All values represent the mean ± S.E.M. (n = 6). Values marked with different lowercase letters are significantly different (one-way ANOVA, P < 0.05)
Response of gcT1R2s to taste substances
The response curves of gcT1R2s to glucose and fructose were shown in Fig. 6a and b. Each gcT1R2/gcT1R3 could mediate glucose- and fructose-induced intracellular calcium signaling compared with the vehicle (pcDNA3.1 transfected group). Moreover, compared with the response of zfT1R2s/zfT1R3 transfected cells, gcT1R2s/gcT1R3 transfected cells presented higher responses to these two sugars. HEK293T cells transfected with gcT1R2E/gcT1R3 and gcT1R2F/gcT1R3 showed a greater response to glucose than those gcT1R2s/gcT1R3 transfected alone. GcT1R2E/gcT1R3 also mediated more active fructose-induced intracellular calcium signaling. Upon stimulation with glucose and fructose, gcT1R2A-F/gcT1R3 mediated a more intensive and sustained calcium signal transduction than gcT1R2/gcT1R3 alone when transfected into HEK293T cells. Cells co-transfected with six gcT1R2s/gcT1R3 showed a lower response to plant specific fructose than those co-transfected with the new four gcT1R2C-F/gcT1R3.
Fig. 6.
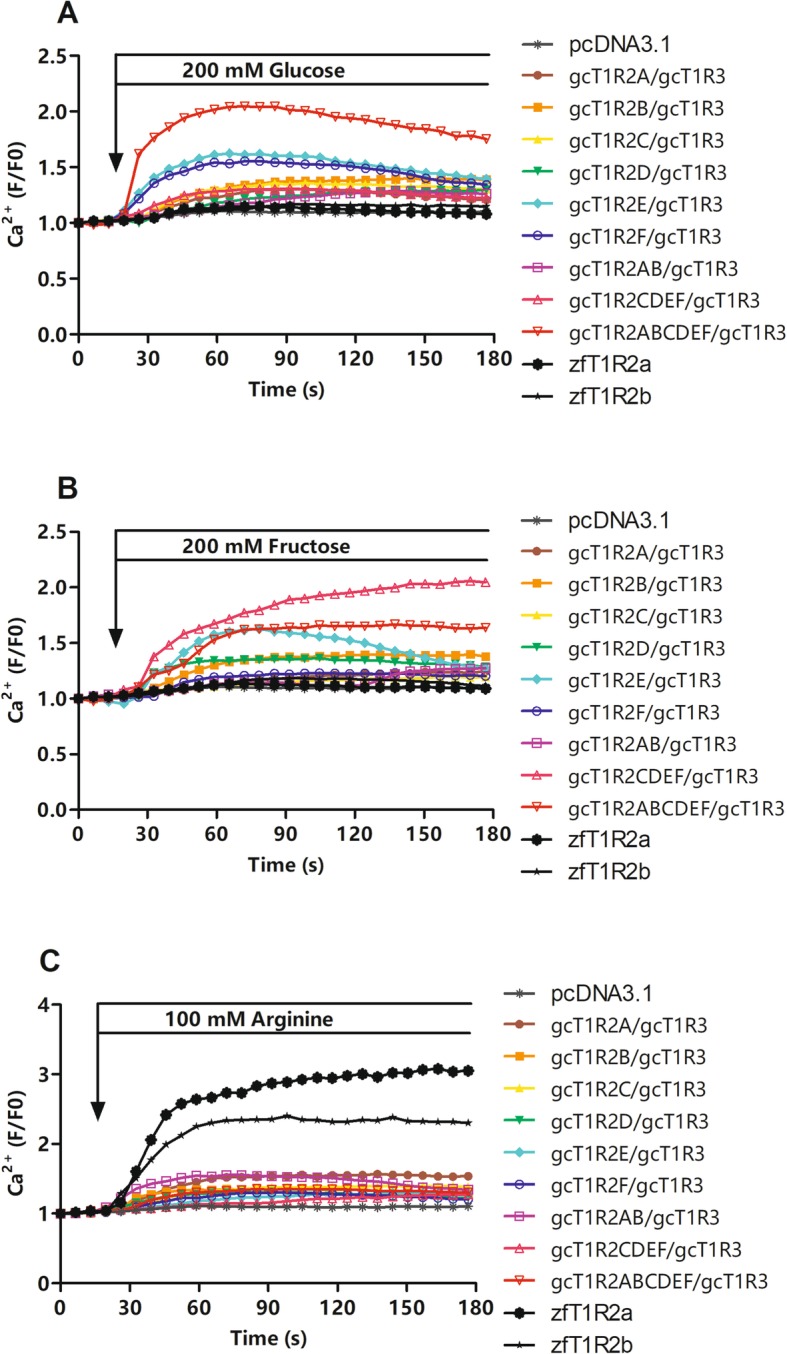
Ca2+ changes in fluorescence intensity of 20 single HEK293T cells upon taste substances. HEK293T cells were stimulated with 200 mM glucose (a), 200 mM fructose (b), and 100 mM arginine (c). Images were recorded at 6.54 s intervals up to 183.16 s using 488 nm excitation filter and 516 nm emission filter and analyzed using FV10-ASW 3.1 Viewer software. The backgrounds of the emission intensities were subtracted. Data are expressed as the ratio of the fluorescence intensities of 20 single HEK293T cells per dish and initial intensity (F/F0)
The response curves of gcT1R2s to arginine were presented in Fig. 6c. Each gcT1R2/gcT1R3 could mediate arginine-induced intracellular calcium signaling compared with the vehicle (pcDNA3.1 transfected group). Moreover, the solo gcT1R2s/gcT1R3 transfected cells presented lower responses to this L-amino acid when compared with the response of zfT1R2s/zfT1R3 transfected cells. No significant differences were observed in the responses of cells to arginine between the solo gcT1R2s/gcT1R3 transfected cells and combined gcT1R2s/gcT1R3 co-transfected cells (included gcT1R2A-B/gcT1R3, gcT1R2C-F/gcT1R3 and gcT1R2A-F/gcT1R3).
The behavioral experiment of perceiving the sugar in grass carp
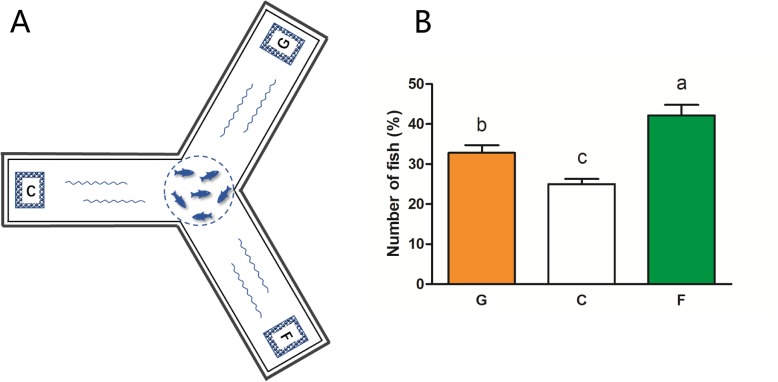
To examine whether gcT1R2/3 function indeed dictates the taste behavior, we performed one behavioral experiment to confirm the behavioral preference to glucose or fructose in grass carp with a tailor-made Y-maze tank (Fig. 7a). At 0.5 h after transparent net opening in the centre of the Y-maze tank, the ratio of fish chose fructose (F group, agarose and fructose mixed granules) was highest, followed by fish chose glucose (G group, agarose and glucose mixed granules), and the lowest rate of fish was observed in the control group (C group, agarose granules) (Fig. 7b).
Fig. 7.
The behavioral experiment of perceiving the sugar in grass carp. a Schematic drawing of experimental setup; b The ratio of fish chose to different experimental feed placement areas at 0.5 h after the transparent net opening (%). The behavioral experiment was repeated for five times. All values represent the mean ± S.E.M. (n = 5). Values marked with different lowercase letters are significantly different (one-way ANOVA, P < 0.05)
Gene expression of T1R2s in grass carp of food habit transition from carnivory to herbivory
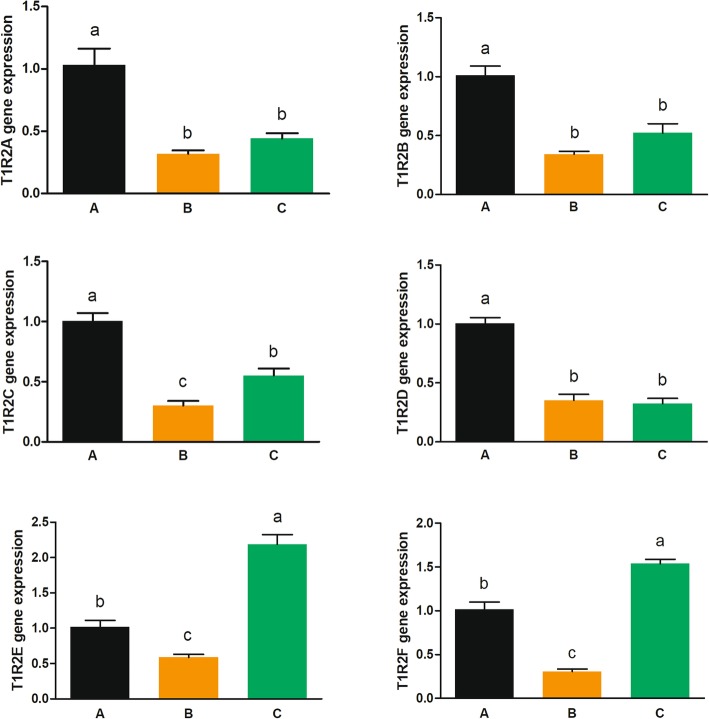
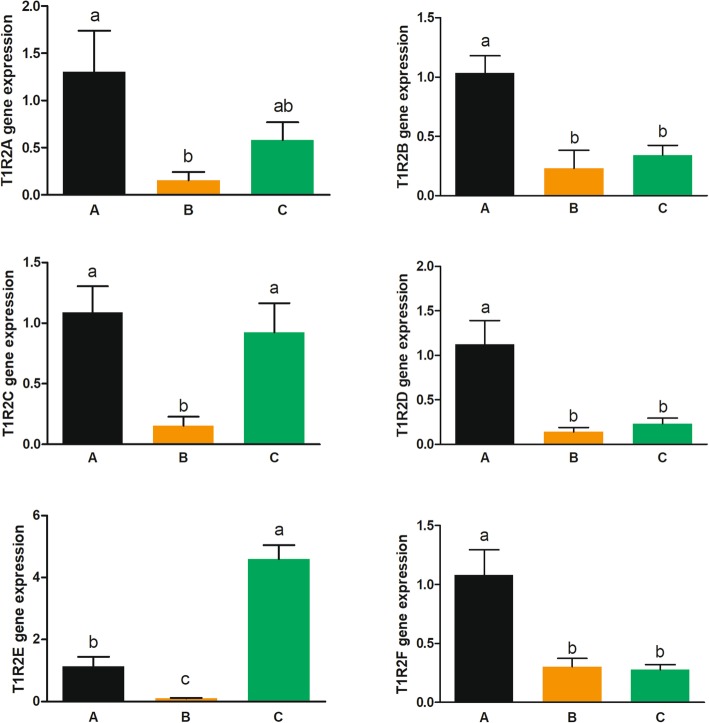
Grass carp without food habit transition (fed with chironomid larvae, Group B) had significantly lower gene expressions of gcT1R2s in both tongue and gut compared with fish before food habit transition (before the feeding trail, Group A) (Figs. 8 and 9). Fish after food transition (fed with duckweed, Group C) had significantly higher gene expressions of gcT1R2C, gcT1R2E and gcT1R2F in tongue than fish without transition (Groups B) (Fig. 8). And Fish in Group C had significantly higher gene expressions of intestinal gcT1R2C and gcT1R2E than Groups B (Fig. 9). Moreover, compared with fish before food habit transition (Group A), the gene expressions of gcT1R2E and gcT1R2F were significantly increased in the tongue of fish after the food habit transition (Group C) from carnivory to herbivory. Parallelly, the gene expression of gcT1R2E was significantly enhanced in the gut of fish in Group C compared with Group A.
Fig. 8.
The gene expressions of gcT1R2s in the tongue of grass carp transition from carnivory to herbivory. Relative mRNA expression was quantified using real-time PCR and normalized against EF1 as a housekeeping gene. All values represent the mean ± S.E.M. (n = 6). Values marked with different lowercase letters are significantly different (one-way ANOVA, P < 0.05)
Fig. 9.
The gene expressions of gcT1R2s in the gut of grass carp transition from carnivory to herbivory. Relative mRNA expression was quantified using real-time PCR and normalized against EF1 as a housekeeping gene. All values represent the mean ± S.E.M. (n = 6). Values marked with different lowercase letters are significantly different (one-way ANOVA, P < 0.05)
Discussion
The genetic basis underlying the formation of food habits in fish is largely unknown [24]. The relationship between the evolution of sweet taste receptor and food habit in fish calls for further investigations. By screening the gene numbers of T1R2s in 15 teleost fishes with variant food habits from different orders, we found eight T1R2 genes and six T1R2 genes in morphologically and ecologically diverse threespine stickleback and typical herbivorous grass carp, in contrast to two or three T1R2 genes reported in some carnivorous and omnivorous fish species. Duplication of T1R2 genes of stickleback, resulting in enhanced perception for substances important for survival and reproduction, has been suggested as an adaptive strategy to varied environment [28]. In the present study, we observed that high T1R2 duplications in grass carp (six copies) as well as blunt snout bream are related to the vegetarian adaptation through the comparative analysis in cyprinid evolution [29]. Therefore, in addition to previously reported pseudogenization of T1R2 in mammals and gene loss in birds, adaptive gene expansion in fishes adds a new layer of complexity to the whole evolutionary story of sweet taste.
The gcT1R2C-F were evolved from and paralogous to the two original gcT1R2s (gcT1R2A and gcT1R2B) according to evolutionary analyses. The estimated divergence time was around 34.7 million years ago. The gcT1R2A and zebrafish T1R2.1, gcT1R2B and zebrafish T1R2.2 each formed an independent cluster, respectively. The original two gcT1R2s are paralogous to the new formed four gcT1R2s and orthologous genes to two zebrafish T1R2s according to the synteny analysis. Meanwhile, the transposition of genes nearby T1R2s among the four selected fishes might accelerate the duplication of T1R2s [30].
We found six gcT1R2s were all expressed in the taste organs such as tongue and gill. In mammals, T1R2 and T1R3 are expressed in glucose sensing cells of the gastrointestinal tract, where they play important roles in nutrient detection, perception and assimilation [31]. In the present study, gcT1R2s were expressed in not only taste organs but also intact gut, indicating their functions in glucose detection and perception. In particular, certain expressions of gcT1R2B, gcT1R2E and gcT1R2F genes were detected in brain, suggesting that partial gcT1R2s might be participated in glucose-sensing in brain like the roles in mammals [32].
Signal transduction of gcT1R2s were determined through calcium imaging analysis in HEK293T cells for functional study. Each gcT1R2/gcT1R3 could mediate glucose-, fructose-, and arginine-induced intracellular calcium signaling. Previous studies also reported that sweet taste stimuli elicited an increase in Ca2+ concentration in mammalian taste cells [4, 33, 34]. Previous studies have reported that transient receptor potential channel M5 and phospholipase C-beta 2 colocalized in fish taste receptor cells, indicating vertebrates share a common molecular component in taste signal transduction [22, 35–37]. Therefore, glucose and fructose activated the intracellular calcium signaling mediated by each gcT1R2/gcT1R3, indicating all gcT1R2s were functional genes.
A previous study that characterized the ligands for T1Rs in zebrafish and medaka fish has shown that both zebrafish and medaka T1R2s/T1R3 responded to some L-amino acids but not to sugars [38]. In the present study, although gcT1R2s/gcT1R3 responded to arginine were not as strong as zfT1R2s/T1R3, gcT1R2s/gcT1R3 still responded to L-amino acid. However, gcT1R2s/gcT1R3 responded to sugars in the current study, which was different from the known response of fish T1R2/3 to sugars. As far as we know, it is the first cell-based evidence of sugar-sensing receptors in teleost fish. Compared to the previous work, especially the experimental results of zebrafish T1R2s/T1R3, the function of T1R2s in grass carp seemed to be transformed to respond to sugars, especially the grass carp-specific duplicated T1R2s.
In addition, a behavioral experiment was performed to confirm the behavioral preference to glucose or fructose in grass carp with a tailor-made Y-maze tank. At 0.5 h after transparent net opening in the centre of the Y-maze tank, the ratio of fish chose fructose was significantly higher than the ratio of fish chose glucose, suggesting grass carp preferred fructose to glucose under the same circumstance. In in vitro experiment, upon stimulation with glucose and fructose, gcT1R2A-F/gcT1R3 mediated a more intensive and sustained calcium signal transduction than gcT1R2/gcT1R3 alone. Interestingly, plant specific fructose stimulated a more active calcium signaling in cells transfected with gcT1R2C-F/gcT1R3 than gcT1R2A-F/gcT1R3, raising the possibility that change in food environment might be a major selective force shaping the adaptive evolution of the gcT1R2s. Therefore, these results indicated that the gene expansion, especially the formation of new four gcT1R2s, was an adaptive strategy to dietary switch.
As grass carp goes through a transition from carnivory to herbivory during its life cycle, the gene expressions of gcT1R2s before and after the food habit transition should be detected to determine its contribution to diet selection. The gene expressions of gcT1R2s in both tongue and gut of grass carp without transition (Group B) were significantly decreased compared with the fish before food habit transition (Group A) fed with the same feed, suggesting the glucose-sensing of this fish might change during growth and development. Despite the changed glucose-sensing during development, food habit transition from carnivory to herbivory was accompanied by increased gene expression of certain gcT1R2s in both tongue and gut when compared fish after food transition (fed with duckweed, Group C) with fish without transition (fed with chironomid larvae, Groups B). In our previous study, we have declared the food habit transition from carnivory to herbivory in grass carp might be due to enhanced gut growth, increased appetite, resetting of circadian phase and enhanced digestion and metabolism, as well as extensive alternative splicing and novel transcript [25, 26]. Here, we found regulation of gcT1R2s expression also drove the food habit transition. Thus, both gene expansion and expression patterns of gcT1R2s contributed to food habit transition from carnivory to herbivory during the evolution of grass carp.
Conclusions
Six sweet taste receptors (gcT1R2A-F) were identified in grass carp which exhibits food habit transition from carnivory to herbivory. The four gcT1R2s (gcT1R2C-F) have been suggested to be evolved from and paralogous to the two original gcT1R2s (gcT1R2A and gcT1R2B). All gcT1R2s were expressed in taste organs and mediated glucose-, fructose- or arginine-induced intracellular calcium signaling, revealing they were functional. In addition, grass carp was performed to prefer fructose to glucose under a behavioral experiment. Parallelly, compared with gcT1R2A-F/gcT1R3 co-transfected cells, gcT1R2C-F/gcT1R3 co-transfected cells showed a higher response to plant-specific fructose, indicating the gene expansion, especially the formation of these new four gcT1R2s, was an adaptive strategy to dietary switch. Moreover, the regulation of gcT1R2s expression drove the food habit transition of grass carp during development. Collectively, our studies provided some evolutional and physiological clues for the formation of herbivory in grass carp.
Methods
Data mining and DNA sequencing
A 0.9-Gb draft genome of a gynogenetic female grass carp adult and a 1.07-Gb genome of a wild male adult are available at the official National Center for Gene Research website (http://www.ncgr.ac.cn/grasscarp/). TBLASTN searches were conducted with E-value 10− 10 against the genomic data using the available T1R2 coding sequence (CDS) of zebrafish Danio rerio, medaka Oryzias latipes, and fugu Takifugu rubripes. Each region of BLAST similarity was extended 5–10 kb in 5′ and 3′ directions to establish a detailed prediction of CDS. The screened sequences were estimated based on the profile hidden Markov model (HMM)-based gene prediction with the program WISE2 [39]. The exon-intron junctions were determined by comparing the genomic sequence with the cDNA sequence using SPIDEY. Then, the cDNA of grass carp tongue was used to verify the obtained sequences. The polymerase chain reaction (PCR) was conducted on Biometra Thermocyclers (Biometra, Germany) using Phanta® Super-Fidelity DNA Polymerase (Vazyme Biotech, Jiangsu, China) with the designed primers (electronic Additional file 2: Table S1). The sequences obtained from the genomic database were named as gcT1R2 genes.
The gene number of sweet taste receptors in teleost fishes was also investigated. By screening from GenBank and previous studies, we obtained the available sequences of T1R2 genes in 15 species of fishes with variant food habits from different orders.
Synteny analysis of T1R2 genes
To determine whether gcT1R2 genes are orthologous to other fish species, we performed a synteny analysis by screening T1R2 flanking genes of zebrafish, medaka and fugu through Genome Data Viewer (GDV).
Alignment and phylogenetic analysis
The T1R2s amino acid sequences of fishes and mammals used in this study are available in NCBI and Ensembl genome browser (electronic Additional file 3: Table S2). Amino acid sequence alignments were performed by ClustalW2.
The evolutionary history was inferred by using the Maximum Likelihood method based on the JTT matrix-based model [40]. The zebrafish V2Rs were selected as the outgroup. Evolutionary analysis was conducted in MEGA7 [41].
Timetree analysis
The T1R2s nucleotide sequences of fishes selected are available in NCBI and Ensembl genome browser (electronic Additional file 4: Table S3). Nucleotide sequence alignments were performed by ClustalW2.
A timetree inferred using the Reltime method [42] and the General Time Reversible model [43]. The coelacanth T1R2s were selected as the outgroup. Evolutionary analysis was conducted in MEGA7 [41].
T1R2s expressions in various tissues
Grass carp was obtained from the Fish Center of Xiantao, Hubei, China. The fish was fed to apparent satiation with a commercial diet (32.0% protein; 9.0% fat; 6.9% moisture; 7.6% ash) twice a day at 08:00 and 16:00 (Beijing time) under a standard laboratory condition. After the 2-week acclimation, six large grass carp (500.9 ± 57.6 g) used for tissue distributions of gcT1R2s were deeply anesthetized with MS222 (200 mg L− 1). The brain, lip, tongue, pharynx, oral epithelium, gill filament, gill raker, liver, foregut, midgut, and hindgut samples were collected. RNA extraction and cDNA transcription were performed with Trizol reagent (Takara, Japan) and PrimeScript™ RT reagent Kit with gDNA Eraser (Takara) according to manufacturer’s protocols.
The primer sets for T1R2s were designed (electronic Additional file 2: Table S1). A set of six housekeeping genes (β-actin, RPL13A, EF1, TUA, and GAPDH) were selected from the transcriptome assemblies [44] to test their transcription stability for tissue panel. GeNorm software was used to compute the expression stability values (M) for each gene where a lower M value corresponds to more stable gene expression.
Real-time PCR assays were carried out on a quantitative thermal cycler (MyiQ™ 2 Two-Color Real-Time PCR Detection System, BIO-RAD, USA) using AceQ® qPCR SYBR® Green Master Mix (Vazyme Biotech) with the designed primers (electronic Additional file 2: Table S1). The PCR parameters were 95 °C for 3 min followed by 40 cycles at 95 °C for 10 s, annealing temperature for 30 s, and a melt curve step. Primer PCR efficiencies of the genes ranged from 97.8 to 102.5%. Gene expression levels were quantified relative to the expression of housekeeping genes using the optimized comparative Ct (2-ΔΔCt) value method [45].
Preparation of recombinant expressional vectors, cell culture and calcium imaging
The complete coding sequences of two zfT1R2s (zebrafish T1R2a and T1R2b) and zfT1R3, and six gcT1R2s and gcT1R3 were subcloned into the pcDNA3.1 expression vector (Invitrogen, Carlsbad, CA) used ClonExpress™ II (Vazyme Biotech), respectively. HEK293T cells were cultured in Dulbecco’s modified Eagle’s medium (DMEM) (Life Technologies, Carlsbad, CA, USA) supplemented with 10% fetal bovine serum (Sigma-Aldrich, Saint Louis, MO) at 37 °C in 5% CO2. The cells were plated at a density of 1 × 10⁶ cells per 20-mm glass bottom cell culture dish the day before the experiment. After 14 h, the cells were transiently transfected 24 h before the experiment with the gcT1R2s/gcT1R3 recombinant expressional plasmids by using Lipofectamine 2000 reagent (Invitrogen). For nutrient starvation experiments, HEK293T cells were placed in phenol-free/glucose-free DMEM (Life Technologies) for 3 h. The experiments were set up three parallel 12 groups: the control group transfected with pcDNA3.1 only; the next six groups co-transfected with sole gcT1R2s and gcT1R3 (gcT1R2/gcT1R3); the 8th group co-transfected with gcT1R2A, gcT1R2B and gcT1R3 (gcT1R2A-B/gcT1R3); the 9th group co-transfected with gcT1R2C, gcT1R2D, gcT1R2E, gcT1R2F and gcT1R3 (gcT1R2C-F/gcT1R3); the 10th group co-transfected with all six gcT1R2s and gcT1R3 (gcT1R2A-F/gcT1R3); the last two groups transfected with zfT1R2a/zfT1R3 and zfT1R2b/zfT1R3.
After 3 h nutrient starvation experiments, cells were washed three times with Dulbecco’s phosphate-buffered saline without calcium and magnesium (DPBS) (HyClone Lab, Logan, UT). Cells were loaded with 4 μM the calcium-bound Fluo-4 dye (Invitrogen) diluted in DPBS for 30 min at 37 °C in 5% CO2 and then washed three times with DPBS and incubated for an additional 30 min at 37 °C. Dishes were placed on the stage of an inverted confocal microscope (FluoView FV1000; Olympus, Tokyo, Japan). The dishes were perfused with 200 mM glucose, 200 mM fructose and 100 mM arginine (Biosharp, Hefei, China) at a rate of 2 mL/min after the first 3 pictures were taken. Baseline was established for at least 15 s before stimulation. Three series of 12 groups cell dishes were treated with 200 mM glucose, 200 mM fructose and 100 mM arginine diluted in DPBS separately. Images were recorded at 6.54 s intervals up to 183.16 s using 488 nm excitation filter and 516 nm emission filter and analyzed using FV10-ASW 3.1 Viewer software. The backgrounds of the emission intensities were subtracted. Data are expressed as the ratio of the fluorescence intensities of 20 single HEK293T cells per dish and initial intensity (F/F0).
The behavioral experiment of perceiving the sugar in grass carp
Before the behavioral experiment, three experimental feeds were prepared by hand, which were small agarose granules (namely C group), agarose and glucose mixed granules (namely G group), and agarose and fructose mixed granules (namely F group), respectively. Grass carp (14.36 ± 0.15 g) were obtained from the fishing ground (Wuhan, China) and placed in a 1000-L tank 1 day prior to the start of experimentation. On the training day, fish was placed at the centre of a tailor-made Y-maze tank with a transparent net to prevent escape (seen in Fig. 7a). Then, the three experimental feeds were placed at the end of different channels separately. At 0.5 h after transparent net opening, the ratio of fish chose to different experimental feed placement areas were counted.
T1R2s gene expression analysis of the food habit transition from carnivory to herbivory in grass carp
Fish and samples were prepared according to our previous experiments of He et al. [25]. The fish embryos were obtained from Wuhan Academy of Agricultural Science and Technology (Wuhan, Hubei Province, China). Grass carp larvae as raised in tanks and fed with chironomid larvae (Chironomus tentans). At days 46 post-hatch (dph) (body weight 0.39 ± 0.05 g, body length 28.05 ± 0.99 mm), fish was randomly selected for sample collection as fish before food habit transition (Group A). The rest of the fish was randomly divided into two groups (n = 1000 for each group) fed with either chironomid larvae as fish without transition (Group B) or duckweed (Lemna minor) as fish after food habit transition to herbivory (Group C). An excess of food was offered 24 h a day and fed for 70 days. At 116 dph (body weight and body length for Group B was 2.97 ± 0.3 g and 53.96 ± 1.80 mm, respectively; those for Group C was 7.34 ± 1.43 g and 72.78 ± 6.15 mm, respectively), 6 fish were randomly selected from the groups for sample collection. The tongue and gut of grass carp were collected and then frozen in liquid nitrogen and stored at − 80 °C for RNA. Total RNA was isolated, and cDNA synthesized as mentioned above.
To detect the gene expressions of T1R2s in grass carp of food habit transition from carnivory to herbivory, real-time PCR assays were carried out as mentioned above.
Statistical analysis
All data were presented as mean ± S.E.M (standard error of the mean). The normality of data was assessed by using SPSS software with the Shapiro-Wilk test. All data were subjected to one-way analysis of variance (one-way ANOVA) using SPSS 17.0 software. Differences between the means were tested by Duncan’s multiple range test after homogeneity of variances was checked. Statistical significance was determined at the 5% level.
Supplementary information
Additional file 1: Dataset S1. The genome sequences of the grass carp sweet taste receptor genes. Exon region is uppercase. Intron region is lowercase. The genome sequences of the grass carp sweet taste receptor genes are provided. Exon region is uppercase. Intron region is lowercase.
Additional file 2: Table S1. Primer sequences. The primer sets for T1R2s sequencing and functional studies.
Additional file 3: Table S2. Amino acid sequence alignments of genes for phylogenetic analysis. Amino acid sequence alignments of those three genes of different species.
Additional file 4: Table S3. Gene accession number for Timetree. The T1R2s nucleotide sequences of fishes selected are provided.
Additional file 5: Table S4. Amino acid sequence identities of T1R2 of various vertebrates. Amino acid sequence identities of T1R2 of various vertebrates are provided.
Additional file 6: Table S5. Expression of candidate reference genes analyzed for the tissue panel using geNorm. GeNorm software was used to compute the expression stability values (M) for each gene where a lower M value corresponds to more stable gene expression.
Acknowledgements
We thank Dr. Lei Zhong for help with evolutionary analyses. We thank Ling Li, Jian Sun, Zheng-Yong Wen, Xiao-Yan Cheng, and Ai-Xuan Li for help with animal experiment.
Abbreviations
- CDS
Coding sequence
- DMEM
Dulbecco’s phosphate-buffered saline without calcium and magnesium
- EF1
Elongation factor 1
- GAPDH
Glyceraldehyde-3-phosphate dehydrogenase
- GPCRs
G protein-coupled receptors
- HMM
Hidden Markov model
- PCR
Polymerase chain reaction
- RPL13A
Ribosomal protein L13a
- T1R
Taste receptor type 1
- T1R2
Taste receptor type 1 member 2
- TUA
Tubulin alpha 1
- β-actin
Actin isoform β
Authors’ contributions
XCY conceived the study, participated in the design of the study, carried out the laboratory work, participated in data analysis, and wrote the first draft of the manuscript. XFL designed the study and contributed to the final version. WJC carried out the laboratory work and assisted with data interpretation. SH collected the source animals and assisted with establishing the experimental treatments. WJG participated in data analysis. KSM participated in the design of the study. All authors have read and approved the manuscript.
Funding
This study was supported by the National Key R&D Program of China, Grant/Award Number: 2018YFD0900400 to XFL and the National Natural Science Foundation of China Grant/Award Number: 31502158 to WJG. The funding bodies for this study had no role in the design of the study, collection of data, data analysis and interpretation, or in writing the manuscript.
Availability of data and materials
The datasets supporting this article have been uploaded as part of the supplementary material.
Ethics approval and consent to participate
All animals and experiments were conducted in accordance with the “Guidelines for Experimental Animals” of the Ministry of Science and Technology (Beijing, China). The study was approved by the Institutional Animal Care and Use Ethics Committee of Huazhong Agricultural University. All efforts were made to minimize suffering.
Consent for publication
Not applicable.
Competing interests
The authors declare that they have no competing interests.
Footnotes
Publisher’s Note
Springer Nature remains neutral with regard to jurisdictional claims in published maps and institutional affiliations.
Supplementary information
Supplementary information accompanies this paper at 10.1186/s12862-020-1590-1.
References
- 1.Bachmanov AA, Beauchamp GK. Taste receptor genes. Annu Rev Nutr. 2007;27:389–414. doi: 10.1146/annurev.nutr.26.061505.111329. [DOI] [PMC free article] [PubMed] [Google Scholar]
- 2.Yarmolinsky DA, Zuker CS, Ryba NJP. Common sense about taste: from mammals to insects. Cell. 2009;139(2):234–244. doi: 10.1016/j.cell.2009.10.001. [DOI] [PMC free article] [PubMed] [Google Scholar]
- 3.Lindemann B. Taste reception. Physiol Rev. 1996;76(3):719–766. doi: 10.1152/physrev.1996.76.3.719. [DOI] [PubMed] [Google Scholar]
- 4.Kinnamon SC, Margolskee RF. Mechanisms of taste transduction. Curr Opin Neurobiol. 1996;6(4):506–513. doi: 10.1016/S0959-4388(96)80057-2. [DOI] [PubMed] [Google Scholar]
- 5.Zhao HB, Yang JR, Xu HL, Zhang JZ. Pseudogenization of the umami taste receptor gene tas1r1 in the giant panda coincided with its dietary switch to bamboo. Mol Biol Evol. 2010;27(12):2669–2673. doi: 10.1093/molbev/msq153. [DOI] [PMC free article] [PubMed] [Google Scholar]
- 6.Zhao HB, Zhou YY, Pinto CM, Charles-Dominique P, Galindo-Gonzalez J, Zhang SY, et al. Evolution of the sweet taste receptor gene tas1r2 in bats. Mol Biol Evol. 2010;27(11):2642–2650. doi: 10.1093/molbev/msq152. [DOI] [PMC free article] [PubMed] [Google Scholar]
- 7.Jiang P, Josue J, Li X, Glaser D, Li W, Brand JG, et al. Major taste loss in carnivorous mammals. Proc Natl Acad Sci U S A. 2012;109(13):4956–4961. doi: 10.1073/pnas.1118360109. [DOI] [PMC free article] [PubMed] [Google Scholar]
- 8.Gracheva EO, Ingolia NT, Kelly YM, Cordero-Morales JF, Hollopeter G, Chesler AT, et al. Molecular basis of infrared detection by snakes. Nature. 2010;464(7291):1006–1011. doi: 10.1038/nature08943. [DOI] [PMC free article] [PubMed] [Google Scholar]
- 9.Zhao GQ, Zhang YF, Hoon MA, Chandrashekar J, Erlenbach I, Ryba NJP, et al. The receptors for mammalian sweet and umami taste. Cell. 2003;115(3):255–266. doi: 10.1016/S0092-8674(03)00844-4. [DOI] [PubMed] [Google Scholar]
- 10.Li X, Li W, Wang H, Cao J, Maehashi K, Huang L, et al. Pseudogenization of a sweet-receptor gene accounts for cats' indifference toward sugar. PLoS Genet. 2005;1(1):27–35. doi: 10.1371/journal.pgen.0010003. [DOI] [PMC free article] [PubMed] [Google Scholar]
- 11.Bachmanov AA, Bosak NP, Lin C, Matsumoto I, Ohmoto M, Reed DR, et al. Genetics of taste receptors. Curr Pharm Des. 2014;20(16):2669–2683. doi: 10.2174/13816128113199990566. [DOI] [PMC free article] [PubMed] [Google Scholar]
- 12.Zimin Aleksey V, Delcher Arthur L, Florea Liliana, Kelley David R, Schatz Michael C, Puiu Daniela, Hanrahan Finnian, Pertea Geo, Van Tassell Curtis P, Sonstegard Tad S, Marçais Guillaume, Roberts Michael, Subramanian Poorani, Yorke James A, Salzberg Steven L. A whole-genome assembly of the domestic cow, Bos taurus. Genome Biology. 2009;10(4):R42. doi: 10.1186/gb-2009-10-4-r42. [DOI] [PMC free article] [PubMed] [Google Scholar]
- 13.Daly K, Al-Rammahi M, Arora DK, Moran AW, Proudman CJ, Ninomiya Y, et al. Expression of sweet receptor components in equine small intestine: relevance to intestinal glucose transport. Am J Physiol Regul Integr Comp Physiol. 2012;303(2):R199–R208. doi: 10.1152/ajpregu.00031.2012. [DOI] [PubMed] [Google Scholar]
- 14.Liu G, Walter L, Tang S, Tan X, Shi F, Pan H, et al. Differentiated adaptive evolution, episodic relaxation of selective constraints, and pseudogenization of umami and sweet taste genes TAS1Rs in catarrhine primates. Front Zool. 2014;11(1):79. doi: 10.1186/s12983-014-0079-4. [DOI] [PMC free article] [PubMed] [Google Scholar]
- 15.Zhu KL, Zhou XM, Xu SX, Sun D, Ren WH, Zhou KY, et al. The loss of taste genes in cetaceans. BMC Evol Biol. 2014;14:218. [DOI] [PMC free article] [PubMed]
- 16.Shi P, Zhang JZ. Contrasting modes of evolution between vertebrate sweet/umami receptor genes and bitter receptor genes. Mol Biol Evol. 2006;23(2):292–300. doi: 10.1093/molbev/msj028. [DOI] [PubMed] [Google Scholar]
- 17.Baldwin MW, Toda Y, Nakagita T, O'Connell MJ, Klasing KC, Misaka T, et al. Sensory biology. Evolution of sweet taste perception in hummingbirds by transformation of the ancestral umami receptor. Science. 2014;345(6199):929–933. doi: 10.1126/science.1255097. [DOI] [PMC free article] [PubMed] [Google Scholar]
- 18.Zhao HB, Li JW, Zhang JZ. Molecular evidence for the loss of three basic tastes in penguins. Curr Biol. 2015;25(4):R141–R142. doi: 10.1016/j.cub.2015.01.026. [DOI] [PMC free article] [PubMed] [Google Scholar]
- 19.Volff JN. Genome evolution and biodiversity in teleost fish. Heredity. 2005;94(3):280–294. doi: 10.1038/sj.hdy.6800635. [DOI] [PubMed] [Google Scholar]
- 20.Hara TJ. Olfaction and gustation in fish: an overview. Acta Physiol Scand. 1994;152(2):207–217. doi: 10.1111/j.1748-1716.1994.tb09800.x. [DOI] [PubMed] [Google Scholar]
- 21.Kasumyan AO, Doving KB. Taste preferences in fishes. Fish Fish. 2003;4(4):289–347. doi: 10.1046/j.1467-2979.2003.00121.x. [DOI] [Google Scholar]
- 22.Ishimaru Y, Okada S, Naito H, Nagai T, Yasuoka A, Matsumoto I, et al. Two families of candidate taste receptors in fishes. Mech Dev. 2005;122(12):1310–1321. doi: 10.1016/j.mod.2005.07.005. [DOI] [PubMed] [Google Scholar]
- 23.Picone B, Hesse U, Panji S, Van Heusden P, Jonas M, Christoffels A. Taste and odorant receptors of the coelacanth-a gene repertoire in transition. J Exp Zool Part B. 2014;322(6):403–414. doi: 10.1002/jez.b.22531. [DOI] [PubMed] [Google Scholar]
- 24.Nei M, Niimura Y, Nozawa M. The evolution of animal chemosensory receptor gene repertoires: roles of chance and necessity. Nat Rev Genet. 2008;9(12):951–963. doi: 10.1038/nrg2480. [DOI] [PubMed] [Google Scholar]
- 25.He S, Liang XF, Li L, Sun J, Wen ZY, Cheng XY, et al. Transcriptome analysis of food habit transition from carnivory to herbivory in a typical vertebrate herbivore, grass carp Ctenopharyngodon idella. BMC Genomics. 2015;16:15. doi: 10.1186/s12864-015-1217-x. [DOI] [PMC free article] [PubMed] [Google Scholar]
- 26.Wang YP, Lu Y, Zhang Y, Ning ZM, Li Y, Zhao Q, et al. The draft genome of the grass carp (Ctenopharyngodon idellus) provides insights into its evolution and vegetarian adaptation. Nat Genet. 2015;47(8):625–631. doi: 10.1038/ng.3280. [DOI] [PubMed] [Google Scholar]
- 27.Watkins CE, Shireman JV, Rottmann RW, Colle DE. Food habits of fingerling grass carp. Prog Fish Culturist. 1981;43(2):95–97. doi: 10.1577/1548-8659(1981)43[95:FHOFGC]2.0.CO;2. [DOI] [Google Scholar]
- 28.Hashiguchi Y, Furuta Y, Kawahara R, Nishida M. Diversification and adaptive evolution of putative sweet taste receptors in threespine stickleback. Gene. 2007;396(1):170–179. doi: 10.1016/j.gene.2007.03.015. [DOI] [PubMed] [Google Scholar]
- 29.Liu H, Chen C, Gao Z, Min J, Gu Y, Jian J, et al. The draft genome of blunt snout bream (Megalobrama amblycephala) reveals the development of intermuscular bone and adaptation to herbivorous diet. Gigascience. 2017;6(7):1–13. doi: 10.1093/gigascience/gix039. [DOI] [PMC free article] [PubMed] [Google Scholar]
- 30.Hao W, Golding GB. Does gene translocation accelerate the evolution of laterally transferred genes? Genetics. 2009;182(4):1365–1375. doi: 10.1534/genetics.109.104216. [DOI] [PMC free article] [PubMed] [Google Scholar]
- 31.Sternini C, Anselmi L, Rozengurt E. Enteroendocrine cells: a site of 'taste' in gastrointestinal chemosensing. Curr Opin Endocrinol. 2008;15(1):73–78. doi: 10.1097/MED.0b013e3282f43a73. [DOI] [PMC free article] [PubMed] [Google Scholar]
- 32.Welcome MO, Mastorakis NE. Emerging concepts in brain glucose metabolic functions: from glucose sensing to how the sweet taste of glucose regulates its own metabolism in astrocytes and neurons. NeuroMolecular Med. 2018;20(3):281–300. doi: 10.1007/s12017-018-8503-0. [DOI] [PubMed] [Google Scholar]
- 33.Huang YA, Roper SD. Intracellular Ca2+ and TRPM5-mediated membrane depolarization produce ATP secretion from taste receptor cells. J Physiol. 2010;588(Pt 13):2343–2350. doi: 10.1113/jphysiol.2010.191106. [DOI] [PMC free article] [PubMed] [Google Scholar]
- 34.Kyriazis GA, Soundarapandian MM, Tyrberg B. Sweet taste receptor signaling in beta cells mediates fructose-induced potentiation of glucose-stimulated insulin secretion. Proc Natl Acad Sci U S A. 2012;109(8):E524–E532. doi: 10.1073/pnas.1115183109. [DOI] [PMC free article] [PubMed] [Google Scholar]
- 35.Zhang YF, Hoon MA, Chandrashekar J, Mueller KL, Cook B, Wu DQ, et al. Coding of sweet, bitter, and umami tastes: different receptor cells sharing similar signaling pathways. Cell. 2003;112(3):293–301. doi: 10.1016/S0092-8674(03)00071-0. [DOI] [PubMed] [Google Scholar]
- 36.Yasuoka A, Aihara Y, Matsumoto I, Abe K. Phospholipase C-beta 2 as a mammalian taste signaling marker is expressed in the multiple gustatory tissues of medaka fish, Oryzias latipes. Mech Develop. 2004;121(7–8):985–989. doi: 10.1016/j.mod.2004.03.009. [DOI] [PubMed] [Google Scholar]
- 37.Yoshida Y, Saitoh K, Aihara Y, Okada S, Misaka T, Abe K. Transient receptor potential channel M5 and phospholipaseC-beta 2 colocalizing in zebrafish taste receptor cells. Neuroreport. 2007;18(15):1517–1520. doi: 10.1097/WNR.0b013e3282ec6874. [DOI] [PubMed] [Google Scholar]
- 38.Oike H, Nagai T, Furuyama A, Okada S, Aihara Y, Ishimaru Y, et al. Characterization of ligands for fish taste receptors. J Neurosci. 2007;27(21):5584–5592. doi: 10.1523/JNEUROSCI.0651-07.2007. [DOI] [PMC free article] [PubMed] [Google Scholar]
- 39.Birney E, Clamp M, Durbin R. GeneWise and Genomewise. Genome Res. 2004;14(5):988–995. doi: 10.1101/gr.1865504. [DOI] [PMC free article] [PubMed] [Google Scholar]
- 40.Jones DT, Taylor WR, Thornton JM. The rapid generation of mutation data matrices from protein sequences. Comput Appl Biosci. 1992;8(3):275–282. doi: 10.1093/bioinformatics/8.3.275. [DOI] [PubMed] [Google Scholar]
- 41.Kumar S, Stecher G, Tamura K. MEGA7: molecular evolutionary genetics analysis version 7.0 for bigger datasets. Mol Biol Evol. 2016;33(7):1870–1874. doi: 10.1093/molbev/msw054. [DOI] [PMC free article] [PubMed] [Google Scholar]
- 42.Tamura K, Battistuzzi FU, Billing-Ross P, Murillo O, Filipski A, Kumar S. Estimating divergence times in large molecular phylogenies. P Natl Acad Sci USA. 2012;109(47):19333–19338. doi: 10.1073/pnas.1213199109. [DOI] [PMC free article] [PubMed] [Google Scholar]
- 43.Nei M, Kumar S. Molecular evolution and phylogenetics. New York: Oxford University Press; 2000.
- 44.Vandesompele Jo, De Preter Katleen, Pattyn Filip, Poppe Bruce, Van Roy Nadine, De Paepe Anne, Speleman Frank. Genome Biology. 2002;3(7):research0034.1. doi: 10.1186/gb-2002-3-7-research0034. [DOI] [PMC free article] [PubMed] [Google Scholar]
- 45.Livak KJ, Schmittgen TD. Analysis of relative gene expression data using real-time quantitative PCR and the 2−ΔΔCT method. Methods. 2001;25(4):402–408. doi: 10.1006/meth.2001.1262. [DOI] [PubMed] [Google Scholar]
Associated Data
This section collects any data citations, data availability statements, or supplementary materials included in this article.
Supplementary Materials
Additional file 1: Dataset S1. The genome sequences of the grass carp sweet taste receptor genes. Exon region is uppercase. Intron region is lowercase. The genome sequences of the grass carp sweet taste receptor genes are provided. Exon region is uppercase. Intron region is lowercase.
Additional file 2: Table S1. Primer sequences. The primer sets for T1R2s sequencing and functional studies.
Additional file 3: Table S2. Amino acid sequence alignments of genes for phylogenetic analysis. Amino acid sequence alignments of those three genes of different species.
Additional file 4: Table S3. Gene accession number for Timetree. The T1R2s nucleotide sequences of fishes selected are provided.
Additional file 5: Table S4. Amino acid sequence identities of T1R2 of various vertebrates. Amino acid sequence identities of T1R2 of various vertebrates are provided.
Additional file 6: Table S5. Expression of candidate reference genes analyzed for the tissue panel using geNorm. GeNorm software was used to compute the expression stability values (M) for each gene where a lower M value corresponds to more stable gene expression.
Data Availability Statement
The datasets supporting this article have been uploaded as part of the supplementary material.


