Abstract
The inducible microsomal prostaglandin E2 synthase 1 (MPGES1) is an integral membrane protein co-expressed with and functionally coupled to cyclooxygenase 2 (COX-2) generating the pro-inflammatory molecule PGE2. The development of effective inhibitors of MPGES1 holds promise as a highly selective route to control inflammation. In this paper we describe the use of backbone amide H/D exchange mass spectrometry to map the binding sites of different types of inhibitors of MPGES1. The results reveal the locations of specific inhibitor binding sites which include the GSH binding site and a hydrophobic cleft in the protein thought to accommodate the prostaglandin H2 substrate. In the absence of three-dimensional crystal structures of the enzyme-bound inhibitors, the results provide clear physical evidence that three pharmacologically active inhibitors bind in a hydrophobic cleft composed of sections of trans-membrane helices Ia, IIb, IIIb and IVb at the interface of subunits in the trimer. In principle, the H/D exchange behavior of the protein can be used as a preliminary guide for optimization of inhibitor efficacy. Finally, a comparison of the structures and H/D exchange behavior of MPGES1 and the related enzyme MGST1 in the presence of glutathione and the inhibitor glutathione sulfonate confirm the unusual observation that two proteins from the same superfamily harbor GSH binding sites in different locations.
Prostaglandin (PG)E2 is a lipid mediator molecule that binds to the E-prostanoid G protein-coupled receptors EP1-4, resulting in a wide range of physiological functions in a variety of tissues throughout the body.1 PGE2 is also well established as a mediator of pathological processes, including chronic inflammation. Arachidonic acid is converted into PGH2 in a two-step process by the cyclooxygenase enzymes, COX-1 and COX-2. PGH2 is then transformed into a series of PGs (D2, E2, F2α, and I2), as well as thromboxane A2 (TXA2), by distinct terminal synthases1.
There are three terminal synthases responsible for PGE2 production, including one cytosolic isoform (CPGES)2 and two membrane-bound enzymes (MPGES1 and MPGES2)3,4. Both CPGES and MPGES2 are constitutively expressed. MPGES1, a member of the superfamily of membrane-associated proteins in eicosanoid and glutathione metabolism (MAPEG), is induced by pro-inflammatory stimuli and is functionally coupled to the inducible isoform of cyclooxygenase, COX-21. MPGES1 catalyzes the conversion of PGH2 to PGE2 in a glutathione (GSH) dependent process as illustrated in Scheme 1. Although GSH is not consumed in the reaction it is an essential cofactor and is crucial for the stability of the enzyme.
Scheme 1.

The most common therapeutic treatment of inflammation is the inhibition of COX enzymes by non-steroidal anti-inflammatory drugs (NSAIDs) or COX-2-selective inhibitors (coxibs). COX inhibition, however, can result in adverse gastrointestinal and cardiovascular side effects, due to subsequently low levels of several prostanoids5. Inasmuch as MPGES1 is the predominant PGE synthase during inflammation and is the terminal enzyme in the PGE2 synthesis pathway, it represents a promising therapeutic target for the treatment of inflammatory diseases. As such, small molecules for the selective inhibition of MPGES1 are currently under development for the treatment of inflammation6. Understanding the nature of the interactions between enzymes and their potential inhibitors is crucial for the design and evaluation of potential drug candidates.
The three dimensional structure of MPGES1 has been recently determined by electron diffraction of two-dimensional crystals.7 It is a homotrimeric, integral membrane protein consisting of twelve trans-membrane helices as illustrated in Figure 1A. Each subunit contributes a bundle of four helices where the N- and C-termini protrude from the luminal side of the endoplasmic reticulum and each monomer contributes a large cytosolic loop. The trimeric enzyme binds three molecules of GSH at the interface of neighboring subunits, making contacts with trans-membrane helices Ia and IIa of one subunit and IIb, IIIb, and IVb of the adjacent subunit. Thus, each active site is composed of elements from two subunits as illustrated in Figure 1B. The putative hydrophobic substrate-binding site of MPGES1 is located on the luminal side of the GSH binding site and is proposed to consist of portions of helices Ia, IIa, IIb and IVb.7
Figure 1.
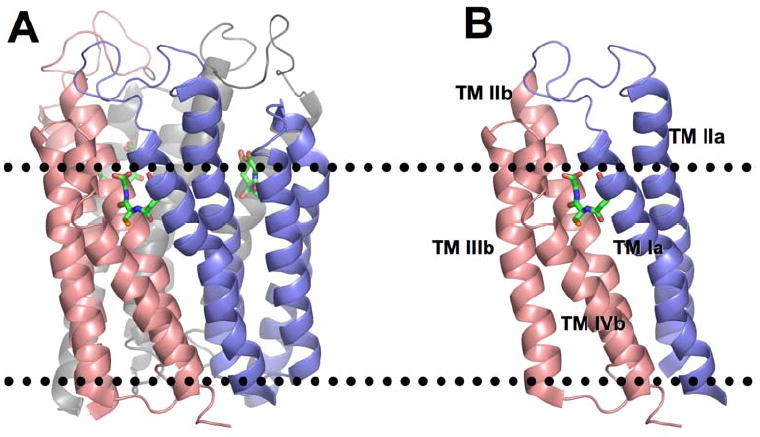
Ribbon representation of the three-dimensional structure of MPGES1 derived from PDB file 3DWW.7 The dotted lines represent the approximate boundaries of the cytosolic (top) and luminal (bottom) sides of the membrane. (A) The three subunits in the trimer are displayed in salmon, blue and grey with the GSH molecules shown in stick representation. (B) A single active site composed of trans-membrane helices Ia and IIa (blue) and helices IIb, IIIb, and IVb in salmon.
Known inhibitors of MPGES1 include molecules that bind in the GSH binding site, such as glutathione sulfonate (GSO3 -), 1, and molecules that bind elsewhere, presumably including the binding site for PGH2. The structures of four known inhibitors of human MPGES1 and their IC50 values are illustrated in Chart 1. Compounds 2, 3, and 4 are representative of pharmacologically active molecules of varying inhibitory potency.
Chart 1.
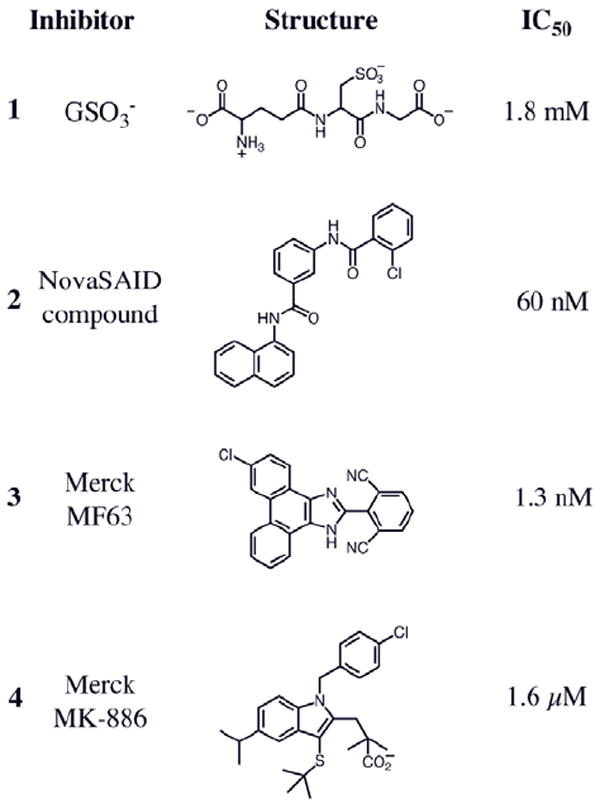
Known inhibitors of human MPGES1 used in this study. The IC50 values for 2, 3 and 4 were reported previously.8-10 The IC50 for 1 was determined in this work.
The kinetics of backbone amide hydrogen/deuterium (H/D) exchange has a long and distinguished history in the assessment of protein structure, ligand binding events and more recently to assess protein biopharmaceutical quality and comparability.11-17 In the last decade the technique has been successfully applied to the analysis of ligand binding to, and the conformational dynamics of integral membrane proteins including members of the MAPEG superfamily.18-21 In this report we demonstrate the utility of H/D exchange mass spectrometry (MS) to locate specific inhibitor binding sites on the integral membrane protein, human MPGES1. The results indicate that there are unique features that distinguish different types of inhibitors and common attributes among some inhibitors discovered by medicinal chemistry efforts.
MATERIALS AND METHODS
Materials
Buffer salts, detergents and common chemicals were of the highest quality commercially available. Glutathione sulfonate, 1, and MK-886, 4, were obtained from Sigma, St. Louis, MO. The NovaSAID compunnd, 2, was a generous gift from NovaSAID AB, Stockholm, Sweden. MF63, 3, was synthesized by the Synthesis Core in the Vanderbilt Institute of Chemical Biology. Its synthesis and characterization is described in Supporting Information.
Protein Expression
The human MPGES1 gene with C-terminal hexa-histidine tag was subcloned into a pET-21b vector. Silent mutations were performed for R40, R74, and R123 to correct for codon bias. Rosetta 2 (DE3) E. coli competent cells were transformed with the expression vector and cultured in minimal media (20 mM Na2HPO4, 20 mM KH2PO4, 90 mM NaCl, 200 mM NH4Cl, 130 μM CaCl2, 1 mM MgSO4, 0.4% glucose, 0.3% casamino acids) at 37 °C and 250 rpm. The cell culture was cooled to 15 °C when an OD600 of 0.7 was reached, and expression was induced with the addition of 2 mM IPTG. The cells were cultured further at 15 °C and 200 rpm for 36 to 40 hours. Cells were harvest by centrifugation at 6,500 × g, 4 °C, for 5 minutes and stored at -20 °C. Frozen cell pellets were suspended in cold lysis buffer (50 mM KH2PO4, 300 mM KCl, 1 mM GSH, 1 mM DTT, 1 mM EDTA, 10% glycerol, pH 8.0). Lysozyme (0.2 mg/mL) was added and stirred for 2 hours at 4 °C. Cells were subsequently lysed further, utilizing sonication (60% power, 50% duty cycle, 2 minutes on, 4 minutes off) on ice, until no longer viscous. Cellular debris was cleared by centrifugation at 10,000 × g, 4 °C, for 30 minutes.
Enzyme Preparation
The membrane fraction from above was isolated using ultracentrifugation at 100,000 × g, 4 °C, for 2 hours. Pellets were washed with 50 mM KH2PO4, pH 8.0, and resuspended in cold extraction buffer (50 mM KH2PO4, 300 mM KCl, 1 mM GSH, 4 mM imidazole, 10% glycerol, 0.5% DDM, pH 8.0). The enzyme was solubilized by gently stirring at 4 °C, overnight. The solubilized enzyme was added to Ni-NTA agarose (~5 mL per 5 g of wet cells), equilibrated with extraction buffer, and was incubated by inverting at 4 °C for 1 hour. Resin was applied to a gravity column and was washed with a similar buffer, containing 35 mM imidazole. MPGES1 was then eluted with a similar buffer, containing 250 mM imidazole. The elution was concentrated to ~1.5 column volumes and then dialyzed, MWCO 6-8 kDa, against 1 L cold ion exchange buffer (50 mM KH2PO4, 1 mM GSH, 20% glycerol, 1% polyoxyethylene(10)dodecyl ether, pH 7.0) at 4 °C overnight. The dialyzed protein was then applied to sulfopropyl sepharose (~1 mL per 15 g of wet cells), equilibrated with ion exchange buffer, in a gravity column. The resin was washed with a similar buffer, containing 1% CHAPS, and was eluted with a linear KCl gradient, 0-200 mM, in a similar buffer, containing 0.5% CHAPS. The extent of purification of the protein was estimated by SDS PAGE. Purified MPGES1 was concentrated in an Amicon ultrafiltration system, MWCO 10 kDa, to 1 mg/mL and was then dialyzed, MWCO 10 kDa, against 200 mL cold MS buffer (50 mM KH2PO4, 300 mM KCl, 1 mM GSH, 1 mM DTT, 7.5% glycerol, 1% CHAPS, pH 7.0) at 4 °C overnight. For preparation of the glutathione sulfonate-bound enzyme, glutathione was replaced with equimolar amounts of glutathione sulfonate at the sulfopropyl sepharose chromatography step, as well as in all subsequent steps.
Enzyme Activity
Glutathione transferase activity was verified using the method previously described22. PGE synthase activity and its inhibition were verified essentially as in reference23, with the following exceptions: purified enzyme concentration was 0.02 mg/mL, reaction time was 5 minutes, and inhibitors were pre-incubated for at least 30 minutes on ice. Inhibitor concentrations were as follows: MK-886, 4, 1 mM (from a 10 mM stock in DMSO); MF63, 3, 100 μM (from a 1 mM stock in DMSO); NovaSAID compound 2, 100 μM (from a 1 mM stock in DMSO); GSO3 -, 5 mM (from a 400 mM stock in 100 mM KH2PO4, pH 7.0). The IC50 for 1 was measured as described in the Supporting Information Figure S10 as described previously8.
Amide Hydrogen/Deuterium Exchange Mass Spectrometry and Kinetic Analysis
Amide H/D exchange experiments were performed essentially as previously described18, with the following exceptions: incubation times ranged from 15 seconds to 8 hours where 1 mg/mL MPGES1, solubilized in 1% (w/v) CHAPS, was digested by the addition of 2 equivalents (w/w) of pepsin (2 μL of a 10 mg/mL solution in H2O) for 5 minutes on ice. It is important to emphasize that all H/D exchange experiments described herein were performed on MPEGS1 solubilized in CHAPS detergent micelles. Previous experiments in our laboratory have shown minimal differences in H/D exchange kinetics of MPGES1 when solubilized in either CHAPS or DDM detergent micelles (data not shown). The detergent CHAPS was ultimately chosen due to its minimal suppression of ionization from the electrospray source. Inhibitor concentrations were as follows: 1 mM GSO3 -, 1, and 100 μM each of 2, 3, and 4.
The kinetics of backbone H/D exchange behavior of each peptide were determined as previously described.18 The data were fit to a single or double exponential equation of the general form as in eq. 1
| Eq. 1 |
in which An and kn are the amplitudes and rate constants of the nth phase of the exchange, D is the number of sites exchanged for deuterium and N is the total number of exchangeable sites in a given peptide. The exchange amplitude at time zero (Afast) represents the number of hydrogens that exchange in the first 15 seconds. The value of Afast is the difference between the sum of the fitted amplitudes (A1 + A2 … + An) in the slow kinetic phases (>15 s) and the total number of exchangeable sites in the peptide. Inasmuch as Afast is not a fitted parameter no errors are reported. Given that the errors in the fitted amplitudes, A1, A2 and A3, are typically < 10% the errors in Afast are estimated to be < 20-30%. The kinetic data were used to identify regions of the enzyme involved in inhibitor binding and were guided by the following criteria. Peptides displaying significant changes in deuterium incorporation rates were those determined to exhibit an increase or decrease in the number of fast-exchanging (Afast) or slow-exchanging sites, comprising 15% of the backbone amide protons in the peptide. For sites exchanging at intermediate rates, a 10-fold change in the rate of exchange for at least one amide site of the peptide was defined as significant.
RESULTS
General Considerations
The H/D exchange kinetics of 19 peptides ranging in size from 3 to 16 residues covering 90% of the 152 residue protein sequence of MPGES1 were monitored over a period of 15 sec to 8 hr. A peptic peptide map of the protein used in this study is presented in Figure S1 in the Supporting Information. Inasmuch as MPEGS1 is unstable in the absence of GSH or GSO3 -, it was not possible to determine the backbone H/D exchange kinetics of the apo-enzyme. The most pertinent H/D exchange kinetic results are illustrated in figures and tables found in the Results and Discussion sections. For completeness, the remainder of the kinetic data not specifically discussed is documented in Supporting Information (Figures S2-S9).
Binding of Glutathione Sulfonate, 1
Although it is not possible to obtain H/D exchange data from apo MPGES1 it is possible to compare the H/D exchange behavior of the MPGES1•GSH complex to that of the MPGES1•1 complex. The results are surprising and revealing. Replacing GSH with 1 increased deuterium incorporation rates for eight of the nineteen peptides including peptides 18-23, 28-31, 32-39, 63-78, 78-83, 124-129, 130-132, and 133-140 (see Figures 2A, B and C, and Supporting Information). There were no instances of significant decreases in deuterium incorporation rates. Clearly, the sulfonate group is disruptive of the native enzyme structure with GSH.
FIGURE 2.
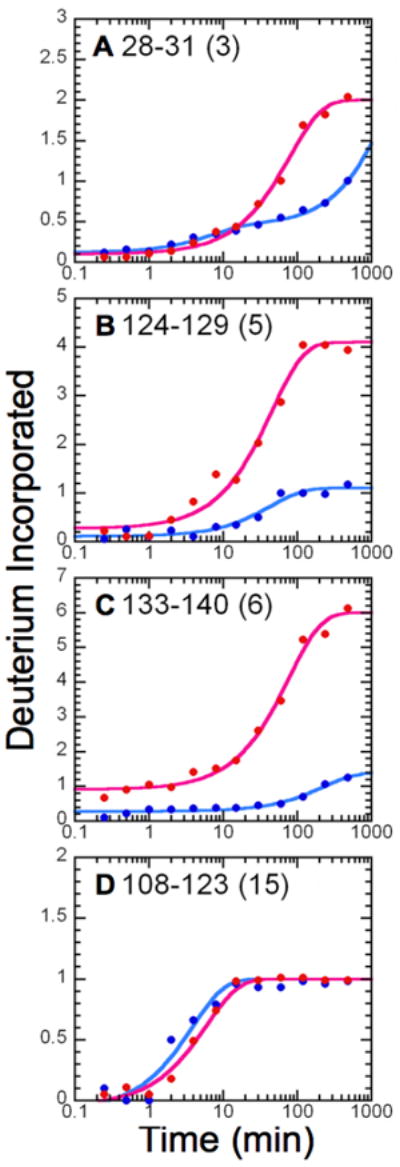
Amide H/D exchange kinetic profiles for MPGES1. Shown are the average kinetic profiles for deuterium incorporation as a function of time for MPGES1 complexed with either GSH (blue) or 1 (red), with the number of exchangeable amide protons for each peptide in parentheses. The amplitudes and rate constants for each peptide are as follows: (A) peptide 28-31 (GSH), A1 = 0.33 ± 0.03, k1 = 0.14 ± 0.02 min-1, A2 = 2.55 ± 0.02, k2 ≤ 5.12 × 10⁻⁴; peptide 28-31 (GSO3−), A1 = 1.90 ± 0.03, k1 = 0.0127 ± 0.0009, A2 = 1.2 ± 0.3, k2 ≤ 1 × 10⁻⁴; (B) peptide 124-129 (GSH), A1 = 0.99 ± 0.04, k1 = 0.023 ± 0.002 min-1; peptide 124-129 (GSO3−), A1 = 3.8 ± 0.1, k1 = 0.022 ± 0.003 min-1; (C) peptide 133-140 (GSH), A1 = 1.12 ± 0.03, k1 = 0.0045 ± 0.0006 min-1; peptide 133-140 (GSO3−), Afast = 0.9, A1 = 5.09 ± 0.09, k1 = 0.013 ± 0.001 min-1; (D) peptide 108-123 (GSH), A1 = 1.07 ± 0.07, k1 = 0.26 ± 0.03 min-1; 108-123 (GSO3−), A1 = 1.04 ± 0.03, k1 = 0.17 ± 0.02 min-1.
Several of these peptides contain at least one residue that is in close proximity (5 Å) to the sulfur of GSH in the crystal structure of the enzyme (Figure 3). Residues within 5 Å of the sulfur include Y28, R110, H113, R126, and Q134. The remaining peptides, 18-23, 63-78, and 78-83, are adjacent to the aforementioned peptides and are located within the GSH binding pocket, as revealed by the crystal structure.7 Inasmuch as the sulfhydryl group of GSH is surrounded by protein residues, it is not too surprising that the introduction of the three additional oxygen atoms of the sulfonate group are sufficient to disrupt the GSH binding site as indicated by the H/D exchange results. Given that the GSH binding pocket is in direct contact with membrane-spanning helices, it is reasonable to expect that contiguous or adjacent helical segments will be affected by perturbations in the GSH binding site.
FIGURE 3.
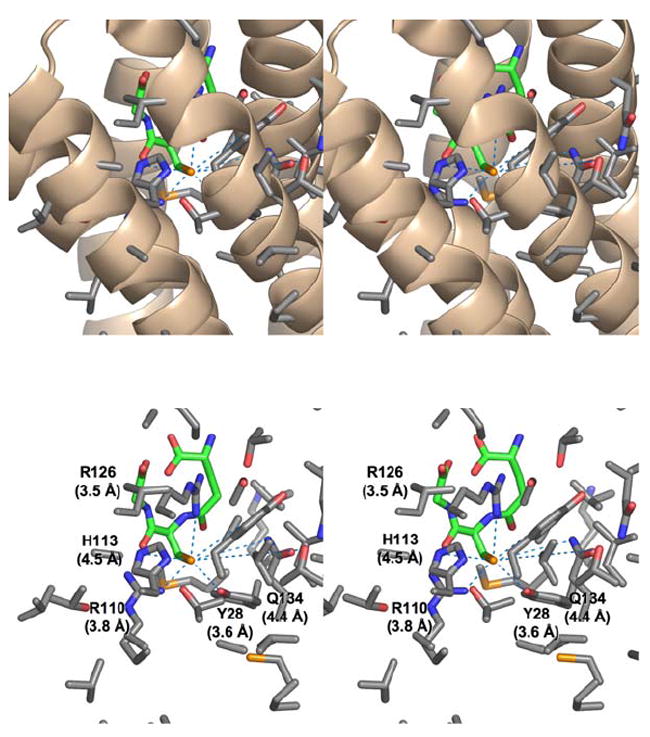
Stereoviews of the residues in close proximity to the sulfhydryl group of GSH in the three-dimensional structure of the MPEGS1•GSH complex.7 (Top) α-Helices near the GSH binding site with associated residues shown in stick representation with carbon, oxygen, nitrogen and sulfur shown in grey, red, blue, and yellow respectively. The model of GSH is shown in stick representation with carbon atoms shown in green. (Bottom) Residues near the sulfur of GSH. Those within 5 Å of the sulfur of GSH are labeled with distances.
It is a bit surprising that there is no change in the extent or kinetics of H/D exchange in peptide 108-123 in helix III (Figure2 D, which harbors two residues (R110 and H113) in close proximity to the sulfhydryl group (Figure 3). This 16-residue peptide in helix IIIb is snugly buried in the core of the protein and is not prone to exchange in the GSH-bound form but with the exception a single amide. This particular site exhibits no significant change in either the amplitude or the rate constant for exchange in the presence of 1 as compared to GSH (A1GSH = 1.07 ± 0.07, k1GSH = 0.26 ± 0.03 min-1 and A11 = 1.04 ± 0.03, k11 = 0.17 ± 0.02 min-1). The structural perturbations introduced by the sulfonate group are obviously manifest elsewhere.
Binding of inhibitors 2, 3, and 4
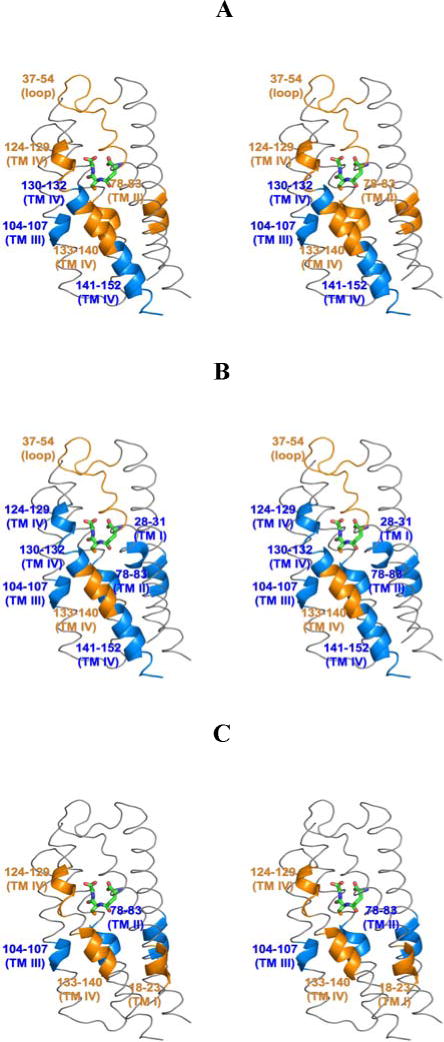
The H/D exchange kinetic results of the MPGES1•GSH complex with inhibitors 2, 3, and 4 bound were compared with those of the GSH-bound enzyme in the absence of inhibitors. All three inhibitors enhanced H/D exchange in some peptides and decreased it in others. The most striking outcome of these experiments is that the changes in H/D exchange kinetics are largely confined to a limited number of common peptides as illustrated qualitatively in Figure 4 and more quantitatively in Figure 5 and Table 1. Most of the affected peptides are relatively short and provide good spatial resolution of the inhibitor binding sites. Inhibitors 2 and 3 have pronounced effects on seven common peptides while inhibitor 4 shares four common peptides with inhibitors 2 and 3. As indicated in Figures 4 and 5, the quantitative effect of an inhibitor on the H/D exchange behavior of a particular peptide varies. Nevertheless, the results do point to a common binding site for all three inhibitors.
FIGURE 4.

Qualitative map of the effect of inhibitor binding to the MPGES1•GSH complex. Affected peptide segments are numbered for each inhibitor where red indicates enhanced H/D exchange and blue signifies decreased exchange in the presence of the inhibitor.
Figure 5.
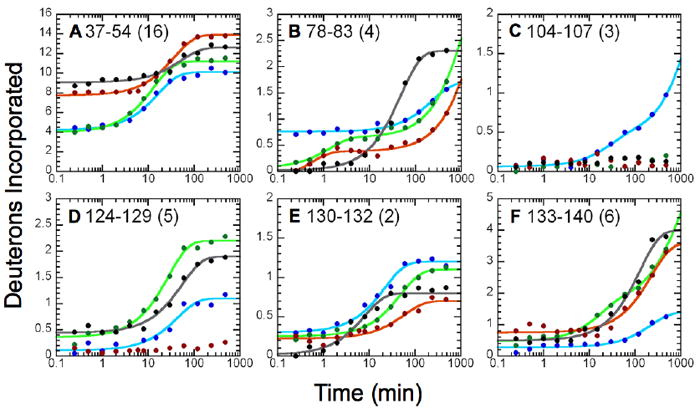
Effects of inhibitor binding on the H/D exchange kinetic profiles of six peptides; (A) peptide 37-54; (B) peptide 78-83; (C) peptide 104-107, (D) peptide 124-129, (E) peptide 130-132 and (F) peptide 133-140. The kinetic profiles for the MPGES1•GSH complex are illustrated in blue, MPGES1•GSH•2 (black) MPGES1•GSH•3 (red) and MPGES1•GSH•4 (green). The rate constants and amplitudes derived from kinetic analysis are given in Table 1.
TABLE 1.
Amplitudes and rate constants for amide H/D exchange of selected peptides (from Figure 5) in the presence of GSH and inhibitors 2, 3 and 4.
| Peptide/Ligand | Afast | A1 (D) | k1 (min-1) | A2 (D) | k2 (min-1) |
|---|---|---|---|---|---|
| A 37-54 (16) | |||||
| GSH | 3.9 | 5.90 ± 0.15 | 0.060 ± 0.005 | 6.18 ± 0.26 | ≤ 1 × 10⁻⁴ |
| 2 | 9.4 | 3.54 ± 0.12 | 0.019 ± 0.003 | 3.09 ± 0.69 | ≤ 1 × 10⁻⁴ |
| 3 | 7.9 | 6.16 ± 0.11 | 0.027 ± 0.002 | 1.93 ± 0.18 | ≤ 1 × 10⁻⁴ |
| 4 | 3.5 | 7.34 ± 0.14 | 0.079 ± 0.005 | 5.19 ± 0.15 | ≤ 1 × 10⁻⁴ |
| B 78-83 (4) | |||||
| GSH | 0.8 | 0.94 ± 0.02 | 0.0043 ± 0.0004 | 2.30 ± 0.13 | ≤ 1 × 10⁻⁴ |
| 2 | 0 | 2.28 ± 0.04 | 0.021 ± 0.001 | 1.69 ± 0.18 | ≤ 1 × 10⁻⁴ |
| 3 | 0 | 0.6 ± 0.2 | 0.61 ± 0.03 | 3.62 ± 0.02 | ≤ 4.80 × 10⁻⁴ |
| 4 | 0 | 0.59 ± 0.08 | 0.75 ± 0.02 | 3.35 ± 0.03 | ≤ 8.29 × 10⁻⁴ |
| C 104-107 (3) | |||||
| GSH | 0 | 0.37 ± 0.05 | 0.036 ± 0.002 | 2.56 ± 0.05 | ≤ 4.90 × 10⁻⁴ |
| 2 | 0 | 3 | ≤ 1 × 10⁻⁴ | ||
| 3 | 0 | 3 | ≤ 1 × 10⁻⁴ | ||
| 4 | 0 | 3 | ≤ 1 × 10⁻⁴ | ||
| D 124-129 (5) | |||||
| GSH | 0 | 0.99 ± 0.04 | 0.023 ± 0.002 | 4.00 ± 0.16 | ≤ 1 × 10⁻⁴ |
| 2 | 0.4 | 1.54 ± 0.03 | 0.018 ± 0.002 | 3.02 ± 0.18 | ≤ 1 × 10⁻⁴ |
| 3 | 0 | 5 | ≤ 1 × 10⁻⁴ | ||
| 4 | 0.3 | 1.84 ± 0.04 | 0.036 ± 0.003 | 2.92 ± 0.10 | ≤ 1 × 10⁻⁴ |
| E 130-132 (2) | |||||
| GSH | 0.3 | 0.90 ± 0.02 | 0.045 ± 0.005 | 0.75 ± 0.05 | ≤ 1 × 10⁻⁴ |
| 2 | 0 | 0.78 ± 0.04 | 0.13 ± 0.02 | 1.21 ± 0.04 | ≤ 1 × 10⁻⁴ |
| 3 | 0.1 | 0.48 ± 0.02 | 0.017 ± 0.003 | 1.37 ± 0.10 | ≤ 1 × 10⁻⁴ |
| 4 | 0.1 | 0.85 ± 0.01 | 0.020 ± 0.001 | 0.95 ± 0.05 | ≤ 1 × 10⁻⁴ |
| F 133-140 (6) | |||||
| GSH | 0 | 1.12 ± 0.03 | 0.0045 ± 0.0006 | 4.88 ± 0.03 | ≤ 1 × 10⁻⁴ |
| 2 | 0.4 | 3.50 ± 0.06 | 0.0079 ± 0.0006 | 2.12 ± 0.06 | ≤ 1 × 10⁻⁴ |
| 3 | 0.7 | 2.85 ± 0.06 | 0.0044 ± 0.0005 | 2.40 ± 0.06 | ≤ 1 × 10⁻⁴ |
| 4 | 0.4 | 1.25 ± 0.11 | 0.06 ± 0.01 | 4.28 ± 0.11 | ≤ 1.09 × 10⁻³ |
In the presence of GSH and 2, deuterium incorporation rates increase for peptides 37-54, 78-83, 124-129, and 133-140 as compared to GSH alone. Additionally, incorporation rates decreased for peptides 104-107, 130-132, and 141-152. In the presence of GSH and 3, deuterium incorporation rates increased for peptides 37-54 and 133-140. Deuterium incorporation rates decreased for peptides 28-31, 78-83, 104-107, 124-129, 130-132, and 141-152. In the presence of GSH and 4, deuterium incorporation rates increased for peptides 18-23, 124-129, and 133-140. Deuterium incorporation rates decreased for peptides 78-83 and 104-107. Just a casual examination of Figure 5 and Table 1 indicates a few common effects on H/D exchange kinetics and many unique features associated with individual inhibitors.
There are several unique signatures that are exhibited by particular inhibitors. The longest peptide (37-54), which contains 18 residues and 16 exchangeable sites, extends from the C-terminal portion of helix I into the cytosolic loop close to and above the GSH binding site. The exchange behavior of this particular peptide is profoundly affected by the presence of either of the two tight-binding inhibitors, 2 or 3, as indicated in Figures 5A, 6A and 6B. The amplitudes of the rapidly exchanging sites increases from Afast = 4 in the MPGES1•GSH complex to Afast = 8 to 9 in the inhibitor complexes. As indicated in Figure 6, the two tight-binding inhibitors extend their influence to the cytosolic domain. In contrast, the MPGES1•GSH•4 complex behaves very much like MPGES1•GSH.
Figure 6.
Stereo views of the impact of inhibitor binding on the H/D exchange behavior of the MPGES1•GSH complex.7 The effects of inhibitors 2, 3 and 4 are shown in panels A, B, and C, respectively. The GSH molecule is shown in stick representation. Regions of enhanced exchange are shown in orange while those with decreased exchange are in blue. Only one potential binding site in the trimer is illustrated.
Another striking difference among the inhibitors is revealed in peptide 124-129 (Figure 5D). While inhibitors 2 and 4 provoke an increase in amplitude of exchange by about one deuteron relative to the MPGES1•GSH complex, inhibitor 3 completely inhibits H/D exchange.
In spite of these differences, all three inhibitors share common attributes as clearly observed in peptide 104-107 (Figure 5C) and peptide 133-140 (Figure 5F). All inhibitors prevent the relatively slow exchange in peptide 104-107, whereas, the three inhibitors promote enhanced exchange in peptide 133-140. The response of peptide 78-83 (Figure 5B) is a more complex situation where all inhibitors decrease the exchange of one site (Afast) but have mixed effects on the second site. Finally, although the single exchange site in peptide 130-132 (Figure 5E) differs in a subtle manner from one inhibitor to another, the relative changes in amplitudes and rate constants are quite small (Table 1).
Figure 6 emphasizes, in three-dimensions, the common distribution of the effects of the three inhibitors on the H/D exchange behavior of the MPGES1•GSH complex. The primary effects for all three compounds are located in helices II, III and, IV toward the luminal side of the GSH binding site. There is also a clear distinction between 4 and the two tight-binding inhibitors, 2 and 3, which result in much more extensive changes in the H/D exchange behavior in the cytosolic loop and helices encompassing the substrate binding cleft.
DICUSSION
Binding of 1 suggests differences in the location of GSH in MPGES1 and MGST1
One of the more interesting results of this study was the observation of very large differences in the H/D exchange behavior of the MPGES1•GSH and MPGES1•1 complexes. A previous comparison of the GSH and GSO3 - complexes of a soluble class Mu glutathione transferase indicated very limited and highly localized differences in H/D exchange kinetics near the –SH/-SO3- groups.24 The results also contrast with a previous comparison of the H/D exchange kinetics of another MAPEG homologue, microsomal glutathione transferase 1, MGST118,20, which shares 38% sequence identity with MPGES1. Like the soluble class Mu enzymes, the differences in H/D exchange behavior between the MGST1•GSH complex and the MGST1•1 are relatively small and localized near the GSH binding site defined by electron diffraction as indicated in Figure 7.
Figure 7.
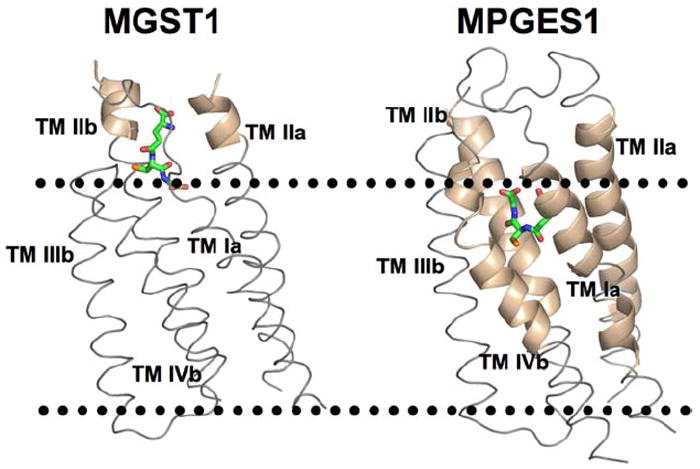
Comparison of the differential impact of GSH/GSO3 - binding on the kinetics of backbone H/D exchange of MGST1•GSH vs. MGST1•1 (left) and MPGES1•GSH vs. MPGES1•1 (right) and the location of the GSH binding site in the proteins as defined by 3D electron diffraction from 2D crystals.7,25 The dotted lines indicate the approximate location of the cytosolic (top) and luminal (bottom) boundaries of the microsomal membrane. The tan helical regions highlight the differential effects of GSH and GSO3 - on the H/D exchange kinetics.
A surprising result of the crystal structure of MGST1 when compared to the structures of the homologous proteins MPGES1 and LTC4S is the different locations of the GSH binding sites and the shape of the GSH molecule as illustrated in Figure 8. While the molecular density and electron density of GSH in MPGES1 and LTC4S co-localize in the protein within the bilayer7,26,27, the density for GSH in the MGST1 structure is located in the cytosolic domain of the protein.25 Moreover, the conformation of the GSH molecule is U-shaped in MPEGS1 and LTC4S but C-shaped in MGST1. This is a novel observation where homologous proteins (ca 40% sequence identity) in the same superfamily appear to bind the common substrate (or cofactor) GSH in a different location and conformation. This difference might be attributed, in part, to an ambiguity in the location of the GSH binding site in MGST1 due to the anisotropy in the resolution of the diffraction data from the 2-dimensional crystals. Regardless, the differential H/D exchange kinetic results with GSH and GSO3 - appear to confirm different locations of the GSH binding sites between MGST1 and its close relatives MPEGS1 and LTC4S.
FIGURE 8.
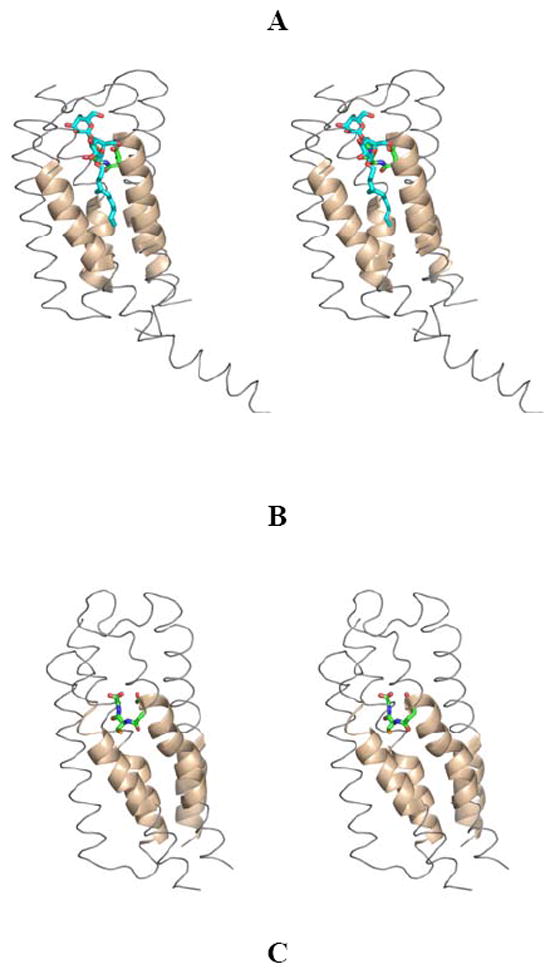
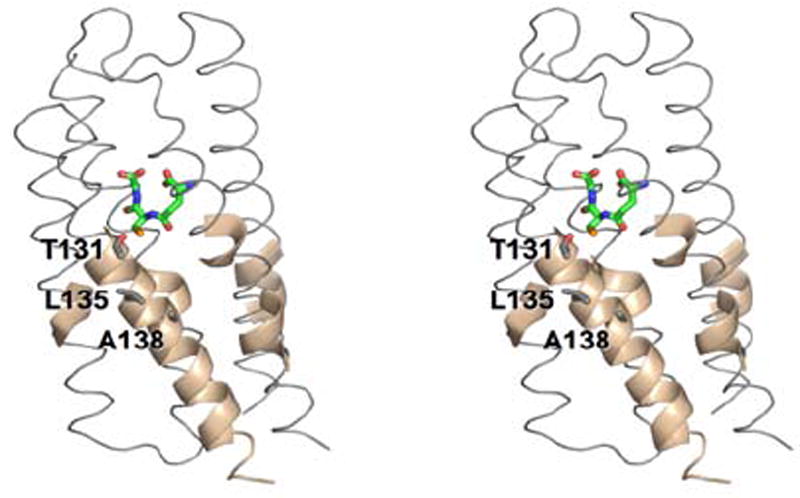
Definition of the leukotriene substrate-binding site. (A) In LTC4S by co-crystallization with GSH in the presence of the detergent n-dodecyl-β-D-maltoside. The DDM and GSH molecules are shown in stick representation. DDM is thought to reside in the leukotriene A4 binding site. (B) In MPGES1 through structural comparison of LTC4S with MPGES1. The GSH molecule is shown in stick representation. (C) In MPEGS1 by H/D exchange kinetics in the presence of inhibitors 2, 3 and 4. The GSH molecule and the side chains of T131, L135 and A138 in helix IV are shown in stick representation.
Binding of inhibitors 2, 3, and 4 define a consensus hydrophobic cleft
Ago, et al.,26 as well as Molina, et al.,27 reported in 2007 the X-ray crystal structures of leukotriene C4 synthase (LTC4S), another member of the MAPEG superfamily, at resolutions of 3.3 and 2.15 Å, respectively. In each case, LTC4S was crystallized in the presence of the detergent n-dodecyl-β-D-maltoside (DDM), and in each case, a detergent molecule was found bound in an ordered fashion within a hydrophobic cleft comprised of helices Ia, IIb and IVb adjacent to the GSH binding site (Figure 8A). The authors of both papers proposed this location to be the substrate-binding site for LTC4S.
A structural comparison of MPGES1 with LTC4S was used to locate the equivalent putative hydrophobic cleft within MPGES1 as illustrated in Figure 8B. Coincidentally, the majority of peptides involved in inhibitor binding, as determined by H/D exchange MS, are localized within this hydrophobic cleft. The only exception is that of the large cytosolic loop connecting helix Ia to helix IIa. In this case, the loop becomes more flexible when the enzyme is inhibitor-bound, perhaps due to a conformational change typically induced by substrate binding, and serving the purpose of facilitating product release into the cytosol.
It has been recently noted that the efficacy of MPGES1 inhibitors is species dependent and defined, in part, by residues located on one face of helix IVb.8 For example, inhibitor 2, which is very potent toward the human enzyme is ineffective against the rat orthologue. This interspecies difference has been mapped by mutagenesis to three crucial residues, T131, L135 and A138 on helix IV of the human enzyme. These critical residues are located in the cleft at the subunit interface where the backbone exhibits a significant enhancement in the kinetics of H/D exchange in the presence of 2, 3 or 4 as illustrated in Figures 5F, 6A and 8C. This behavior suggests that the binding of these three inhibitors increase the conformational dynamics of the protein backbone in this section of helix IV. The H/D exchange results are clearly consistent with the mutagenesis analysis that identifies this region as crucial for inhibitor binding.
Finally, it is not possible to definitively ascertain from the present data if any of the inhibitors, 2, 3 or 4, displace GSH upon binding to the hydrophobic cleft. However, this possibility seems unlikely at least in the cases of 2 and 4. Compound 2 inhibits MPGES1 in a strictly competitive manner with respect to the substrate PGH2 while compound 4 exhibits mixed-type inhibition with a predominant competitive component vs. the same substrate.28 Moreover, both 2 and 4 and similar inhibitors exhibit a predominant noncompetitive component when GSH is the varied substrate. This information argues that inhibitors 2, 3 and 4 do not displace GSH in the inhibited complexes.
Conclusions
Backbone amide hydrogen/deuterium exchange kinetics is an excellent tool to map inhibitor-binding sites in purified integral membrane protein targets. Differences in the location of inhibitor sites and their individual impression on the conformational dynamics of the protein are easily distinguished. Inasmuch as there is no crystal structure or NMR structure of an MPGES1•inhibitor complex, the data reported here represent to only direct physical evidence for the location of inhibitor binding sites. In principle, there is no reason that the technique cannot be used in a multi-peptide assay to rapidly screen desirable inhibitor properties in situations where the target protein-inhibitor complexes cannot be easily interrogated by higher resolution techniques such as crystallography or NMR spectroscopy. The H/D exchange kinetics of MPGES1•GSH and MPGES1•GSO3 - reveals very dramatic differences in the exchange behavior of the complexes in marked contrast to previous experiments with the related enzyme, microsomal glutathione transferase 1 (MGST1). These observations suggest that there are fundamental differences in the mode of binding of GSH to MPGES1 where it acts as a cofactor and MGST1 where it is a substrate.
Supplementary Material
Acknowledgments
The authors thank Dr. Caroline Jegerschöld and Prof. Hans Hebert for helpful discussions.
Funding Sources This work was supported by NIH Grants R01 GM030910 (to RNA), T32 GM008320 (to EBP), T32 ES007028 and F32 ES013105 (to LSB) and P30 ES000267, the Swedish Research Council and the Ulla och Gustaf af Ugglas foundation.
ABBREVIATIONS
- CHAPS
3-[(3-cholamidopropyl)-dimethylammonio]-1-propane sulfonate
- COX-1
cyclooxygenase 1
- COX-2
cyclooxygenase 2
- coxib
COX-2 selective inhibitor
- CPGES
cytosolic prostaglandin E synthase
- DDM
n-dodecyl-β-D-maltopyranoside
- DTT
dithiothreitol
- EDTA
ethylenediaminetetraacetic acid
- EP1-4
E-prostanoid receptors 1-4
- GSH
glutathione
- GSO3-
glutathione sulfonate
- H/D exchange
hydrogen/deuterium exchange
- IPTG
isopropyl-β-D-1-thiogalactopyranoside
- LTC4S
leukotriene C4 synthase
- MAPEG
membrane associated proteins in eicosanoid and glutathione metabolism
- MF63
2-(6-Chloro-1H-phenanthro[9,10-d]imidazol-2-yl)-isophthalonitrile
- MGST1
microsomal glutathione transferase 1
- MK-886
1-[(4-chlorophenyl)methyl]-3-[(1,1-dimethylethyl)thio]-α,α-dimethyl-5-(1-methylethyl)-1H-indole-2-propanoic acid
- MPGES1
microsomal prostaglandin E synthase 1
- MPGES2
microsomal prostaglandin E synthase 2
- MS
mass spectrometry
- MWCO
molecular weight cut-off
- Ni-NTA
nickel-nitriloacetic acid
- NSAID
non-steroidal anti-inflammatory drug
- OD
optical density
- PAGE
polyacrylamide gel electrophoresis
- PG
prostaglandin
- PGD2
prostaglandin D2
- PGE2
prostaglandin E2
- PGES
prostaglandin E synthase
- PGF2α
prostaglandin F2α
- PGH2
prostaglandin H2
- PGI2
prostacyclin
- SDS
sodium dodecyl sulfate
- TXA2
thromboxane A2
Footnotes
ASSOCIATED CONTENT Supporting Information. Thirteen pages including Figure S1, the peptic peptide map of MPGES1, Figures S2-S9, H/D exchange profiles including the amplitudes and rate constants for regions of the protein not explicitly discussed in the paper, Figure S10, the determination of the IC50 for 1, and the synthesis and characterization of the inhibitor MF63, 3. This material is available free of charge via the Internet at http://pubs.acs.org.
References
- 1.Samuelsson B, Morgenstern R, Jakobsson PJ. Membrane prostaglandin E synthase-1: a novel therapeutic target. Pharmacol Rev. 2007;59:207–224. doi: 10.1124/pr.59.3.1. [DOI] [PubMed] [Google Scholar]
- 2.Tanioka T, Nakatani Y, Semmyo N, Murakami M, Kudo I. Molecular identification of a cytosolic prostaglandin E2 synthase that is functionally coupled with cyclooxygenase-1 in immediate prostaglandin E2 biosynthesis. J Biol Chem. 2000;275:32775–32782. doi: 10.1074/jbc.M003504200. [DOI] [PubMed] [Google Scholar]
- 3.Jakobsson P-J, Thoren S, Morgenstern R, Samuelsson B. Identification of human prostaglandin E synthase: A microsomal glutathione-dependent, inducible enzyme, constituting a potential drug target. Proc Natl Acad Sci USA. 1999;96:7220–7225. doi: 10.1073/pnas.96.13.7220. [DOI] [PMC free article] [PubMed] [Google Scholar]
- 4.Tanikawa N, Ohmiya Y, Ohkubo H, Hashimoto K, Kangawa K, Kojima M, Ito S, Watanabe K. Identification and characterization of a novel type of membrane-associated prostaglandin E synthase. Biochem Biophys Res Commun. 2002;291:884–889. doi: 10.1006/bbrc.2002.6531. [DOI] [PubMed] [Google Scholar]
- 5.Marnett LJ. The COXIB experience: a look in the rearview mirror. Annu Rev Pharmacol Toxicol. 2009;49:265–290. doi: 10.1146/annurev.pharmtox.011008.145638. [DOI] [PubMed] [Google Scholar]
- 6.Wang J, Limburg D, Carter J, Mbalaviele G, Gierse J, Vazques M. Selective inducible microsomal prostaglandin E2 synthase-1 (mPGES-1) inhibitors derived from an oxicam template. Bioorg Med Chem Lett. 2010;20:1604–1609. doi: 10.1016/j.bmcl.2010.01.060. [DOI] [PubMed] [Google Scholar]
- 7.Jegerschöld C, Pawelzik SC, Purhonen P, Bhakat P, Gheorghe KR, Gyobu N, Mitsuoka K, Morgenstern R, Jakobsson PJ, Hebert H. Structural basis for induced formation of the inflammatory mediator prostaglandin E2. Proc Natl Acad Sci U S A. 2008;105:11110–11115. doi: 10.1073/pnas.0802894105. [DOI] [PMC free article] [PubMed] [Google Scholar]
- 8.Pawelzik SC, Uda NR, Spahiu L, Jegerschöld C, Stenberg P, Hebert H, Morgenstern R, Jakobsson PJ. Identification of key residues determining species differences in inhibitor binding of microsomal prostaglandin E synthase-1. J Biol Chem. 2010;285:29254–29261. doi: 10.1074/jbc.M110.114454. [DOI] [PMC free article] [PubMed] [Google Scholar]
- 9.Xu D, Rowland SE, Clark P, Giroux A, Cote B, Guiral S, Salem M, Ducharme Y, Friesen RW, Methot N, Mancini J, Audoly L, Riendeau D. MF63 [2-(6-chloro-1H-phenanthro[9,10-d]imidazol-2-yl)-isophthalonitrile], a selective microsomal prostaglandin E synthase-1 inhibitor, relieves pyresis and pain in preclinical models of inflammation. J Pharmacol Exp Ther. 2008;326:754–763. doi: 10.1124/jpet.108.138776. [DOI] [PubMed] [Google Scholar]
- 10.Riendeau D, Aspiotis R, Ethier D, Gareau Y, Grimm EL, Guay J, Guiral S, Juteau H, Mancini JA, Methot N, Rubin J, Friesen RW. Inhibitors of the inducible microsomal prostaglandin E2 synthase (mPGES-1) derived from MK-886. Bioorg Medicinal Chem Lett. 2005;15:3352–3355. doi: 10.1016/j.bmcl.2005.05.027. [DOI] [PubMed] [Google Scholar]
- 11.Hvidt A, Linderstrom-Lang K. Exchange of hydrogen atoms in insulin with deuterium atoms in aqueous solutions. Biochim Biophys Acta 4. 1954;14:574–575. doi: 10.1016/0006-3002(54)90241-3. [DOI] [PubMed] [Google Scholar]
- 12.Englander JJ, Rogero JR, Englander SW. Protein hydrogen exchange studied by the fragment separation method. Anal Biochem. 1985;1:234–244. doi: 10.1016/0003-2697(85)90033-8. [DOI] [PMC free article] [PubMed] [Google Scholar]
- 13.Englander WS, Mayne L, Bai Y, Sosnick TR. Hydrogen exchange: the modern legacy of Linderstrøm-Lang. Protein Sci. 1997;5:1101–1109. doi: 10.1002/pro.5560060517. [DOI] [PMC free article] [PubMed] [Google Scholar]
- 14.Zhang Z, Smith DL. Determination of amide hydrogen exchange by mass spectrometry: A new tool for protein structure elucidation. Protein Sci. 1993;4:522–531. doi: 10.1002/pro.5560020404. [DOI] [PMC free article] [PubMed] [Google Scholar]
- 15.Hoofnagle AN, Resing KA, Ahn NG. Protein analysis by hydrogen exchange mass spectrometry. Annu Rev Biophys Biomol Struct. 2003;32:1–25. doi: 10.1146/annurev.biophys.32.110601.142417. [DOI] [PubMed] [Google Scholar]
- 16.Busenlehner LS, Armstrong RN. Insights into protein structure and dynamics elucidated by amide H/D exchange mass spectrometry. Arch Biochem Biophys. 2005;433:34–44. doi: 10.1016/j.abb.2004.09.002. [DOI] [PubMed] [Google Scholar]
- 17.Houde D, Berkowitz SA, Engen JR. The utility of hydrogen/deuterium exchange mass spectrometry in biopharmaceutical comparability studies. J Pharm Sci. 2010;100:2071–2086. doi: 10.1002/jps.22432. [DOI] [PMC free article] [PubMed] [Google Scholar]
- 18.Busenlehner LS, Codreanu SG, Holm PJ, Bhakat P, Hebert H, Morgenstern R, Armstrong RN. Stress sensor triggers conformational response of the integral membrane protein MGST1. Biochemistry. 2004;43:11145–11152. doi: 10.1021/bi048716k. [DOI] [PubMed] [Google Scholar]
- 19.Busenlehner LS, Salomonsson L, Brzezinski P, Armstrong RN. Mapping protein dynamics in catalytic intermediates of the redox-driven proton pump cytochrome c oxidase. Proc Natl Acad Sci USA. 2006;103:15398–15403. doi: 10.1073/pnas.0601451103. [DOI] [PMC free article] [PubMed] [Google Scholar]
- 20.Busenlehner LS, Ålander J, Jegerschöld C, Holm PJ, Bhakat P, Hebert H, Morgenstern R, Armstrong RN. Location of substrate binding sites within the integral membrane protein microsomal glutathione transferase-1. Biochemistry. 2007;46:2812–2822. doi: 10.1021/bi6023385. [DOI] [PubMed] [Google Scholar]
- 21.Busenlehner LS, Branden G, Brzezinski P, Armstrong RN. Structural elements involved in the proton translocation by cytochrome c oxidase as revealed by backbone amide hydrogen-deuterium exchange of the E286H mutant. Biochemistry. 2008;47:73–83. doi: 10.1021/bi701643a. [DOI] [PubMed] [Google Scholar]
- 22.Thorén S, Weinander R, Saha S, Jegerschöld C, Pettersson PL, Samuelsson B, Hebert H, Hamberg M, Morgenstern R, Jakobsson PJ. Human microsomal prostaglandin E synthase-1: purification, functional characterization, and projection structure determination. J Biol Chem. 2003;278:22199–22209. doi: 10.1074/jbc.M303227200. [DOI] [PubMed] [Google Scholar]
- 23.Thorén S, Jakobsson PJ. Coordinate up- and down-regulation of glutathione-dependent prostaglandin E synthase and cyclooxygenase-2 in A549 cells: inhibition by NS-398 and leukotriene C4. Eur J Biochem. 2000;267:6428–6434. doi: 10.1046/j.1432-1327.2000.01735.x. [DOI] [PubMed] [Google Scholar]
- 24.Codreanu SG, Thompson LC, Hachey DL, Dirr HW, Armstrong RN. Influence of the Dimer Interface on Glutathione Transferase Structure and Dynamics Revealed by Amide H/D Exchange Mass Spectrometry. Biochemistry. 2005;44:10605–10612. doi: 10.1021/bi050836k. [DOI] [PubMed] [Google Scholar]
- 25.Holm PJ, Bhakat P, Jegerschöld C, Gyobu N, Mitsuoka K, Fujiyoshi Y, Morgenstern R, Hebert H. Structural basis for detoxification and oxidative stress protection in membranes. J Mol Biol. 2006;360:934–945. doi: 10.1016/j.jmb.2006.05.056. [DOI] [PubMed] [Google Scholar]
- 26.Ago H, Kanaoka Y, Irickura D, Lam BK, Shimamura T, Austen KF, Miyano M. Crystal structure of a human membrane protein involved in cysteinyl leukotriene biosynthesis. Nature. 2007;448:609–612. doi: 10.1038/nature05936. [DOI] [PubMed] [Google Scholar]
- 27.Molina DM, Wetterholm A, Kohl A, McCarthy AA, Niegowski D, Ohlson E, Hammarberg T, Eshaghi S, Haeggström JZ, Nordlund P. Structural basis for synthesis of inflammatory mediators by human leukotriene C4 synthase. Nature. 2007;448:613–616. doi: 10.1038/nature06009. [DOI] [PubMed] [Google Scholar]
- 28.Spahiu L, Stenberg P, Larsson C, Wannberg J, Alterman M, Kull B, Nekhotiaeva N, Morgenstern R. A Facilitated Approach to Evaluate the Inhibitor Mode and Potency of Compounds Targeting Microsomal Prostaglandin E Synthase-1. Assay Drug Dev Technol. 2011 doi: 10.1089/adt.2010.0350. in press. [DOI] [PubMed] [Google Scholar]
Associated Data
This section collects any data citations, data availability statements, or supplementary materials included in this article.


