Abstract
A fundamental and unresolved question in regenerative biology is how tissues return to homeostasis after injury. Answering this question is essential for understanding the etiology of chronic disorders such as inflammatory bowel diseases and cancer1. We used the Drosophila midgut2 to investigate this and discovered that during regeneration a subpopulation of cholinergic3 neurons triggers Ca2+ currents among intestinal epithelial cells, the enterocytes, to promote return to homeostasis. We found that down-regulation of the conserved cholinergic enzyme Acetylcholinesterase4 in the gut epithelium enables acetylcholine from specific TNF/Egr5-sensing cholinergic neurons to activate nicotinic receptors in innervated enterocytes. This activation triggers high Ca2+ that spreads in the epithelium through Inx2/Inx7 gap junctions6, promoting enterocyte maturation followed by reduction of proliferation and inflammation. Disrupting this process causes chronic injury consisting of ion imbalance, Yki/Yap activation7, cell death and increase of inflammatory cytokines reminiscent of inflammatory bowel diseases8. Altogether, the conserved cholinergic pathway facilitates epithelial currents that heal the intestinal epithelium. Our findings demonstrate nerve- and bioelectric9-dependent intestinal regeneration and advance our current understanding of how a tissue returns to homeostasis after injury.
The cholinergic pathway is an ancient conserved pathway used by peripheral neurons to communicate with internal organs3. The two cholinergic receptors, nicotinic and muscarinic, and enzymes modulating acetylcholine (ACh) metabolism, e.g. Acetylcholinesterase (AChE/Ace), are highly conserved and expressed in non-neuronal tissues3. Cholinergic receptors regulate ion transport in the intestinal epithelium which is vital for water and nutrient absorption10. Recently, attention has been given to the anti-inflammatory properties of the cholinergic pathway, with reduced ACh responsiveness associated with intestinal diseases11.
The Drosophila midgut, equivalent to mammalian small intestine, has been used to identify conserved molecular pathways that trigger inflammation and regeneration in the injured epithelium1,12. The midgut epithelium is single-layered and comprised of enterocytes (ECs), large polyploid epithelial cells specialized in absorption, secretory enteroendocrine cells (EEs) and progenitor cells (PCs)2,13,14. The visceral muscle and trachea surround the midgut epithelium, whereas anterior and posterior midgut regions are innervated by enteric neurons2. When the epithelium is injured, intestinal stem cells (ISCs) divide rapidly, giving rise to daughter cells (EBs) that differentiate into ECs and EEs2. Depending on the injury or infection, a multifaceted interplay of conserved inflammatory and regenerative pathways (e.g., EGFR, JAK-STAT, Wnt, BMP, Yki/Yap) activate ISC proliferation so that a sufficient PC (ISC/EB) pool replenishes the epithelium15. Despite the in-depth understanding of how repair is triggered, it is unclear how these pathways are dampened once the epithelium transitions to homeostasis. Following specific damage, the BMP pathway has been reported to have dual roles first promoting proliferation and later ISC-quiescence16,17.
Here, we provide evidence for the fundamental role of an epithelial bioelectric mechanism controlled by cholinergic neurons that occurs as the midgut transitions from colitis-like injury to homeostasis – a phase we refer to as recovery. We show that during recovery, ECs become more sensitive to ACh by downregulating Ace and upregulating nAChR subunit β3 (nAChRβ3). Also, specific TNF/Egr-regulated cholinergic neurons, that we refer to as ARCENs, strengthen the axonal properties of their enteric innervations. We demonstrate that transition to homeostasis relies on the healing functions of nAChR-mediated Ca2+ currents among ECs, that spread through Inx2/Inx7 gap junctions and are triggered by local ARCEN-EC cholinergic signaling.
ECs are sensitive to ACh during recovery
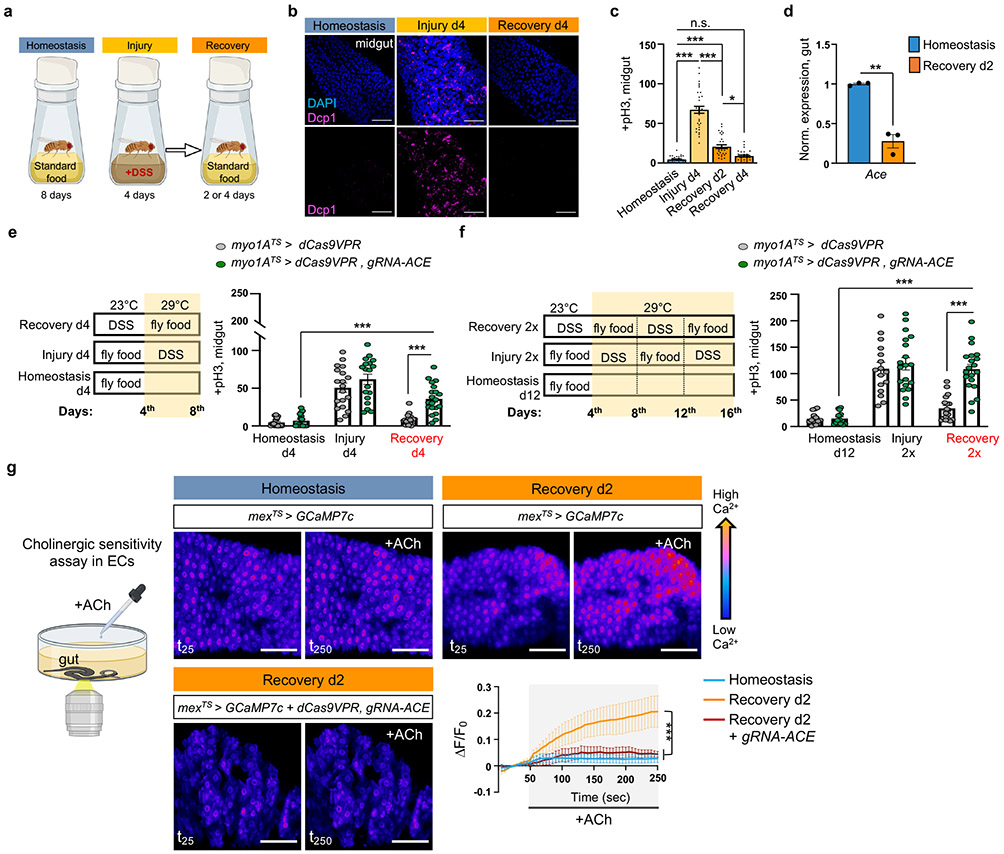
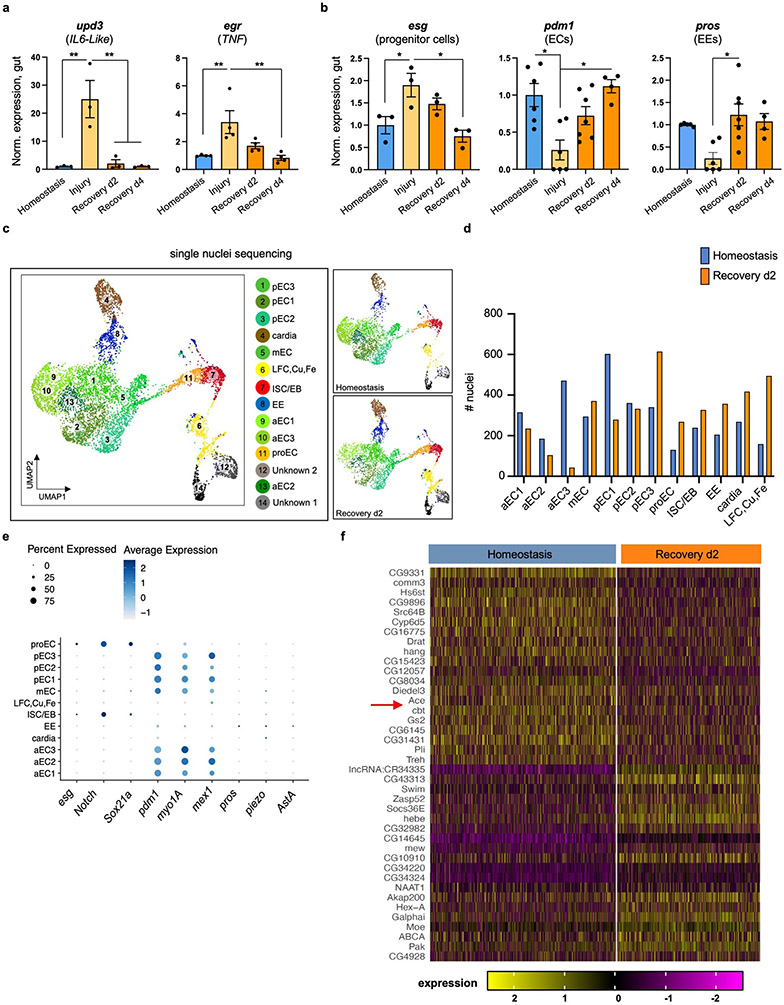
To study the Drosophila intestinal epithelium while it transitions to homeostasis after injury, we damaged the gut with dextran sodium sulfate (DSS), then returned flies to standard food. DSS induces colitis in mammals8 and has been used in Drosophila to identify conserved proliferative pathways15. We fed flies DSS for 4 days (injury) followed by two or four days of standard food (recovery, Fig.1a). Gut damage elevated the expression of effector Drosophila caspase 1 (Dcp1), indicative of cell death (Fig.1b), and of conserved inflammatory cytokines such as IL6-like unpaired 3 (upd3)18 and TNF homolog eiger (egr)5 (Ext. Data Fig.1a), resembling DSS-induced colitis8. Once flies were transferred to standard food, the epithelium required 4 days to return to homeostasis as determined by the levels of i) inflammatory cytokines (Ext. Data Fig.1a), ii) cell death (Fig.1b), iii) ISC proliferation (with mitotic marker anti-phospho-Histone3 (pH3), Fig. 1c), and iv) expression of PC marker escargot (esg; Ext. Data Fig.1b) and two markers of mature cells, pdm1, marker of ECs, and prospero (pros), marker of EEs (Ext. Data Fig.1b).
Fig.1 ∣. ACh sensitivity is required for recovery.
a, Experimental design illustration. Midgut of OreR flies with cell death marker anti-Dcp1 (Drosophila caspase 1, magenta) and DAPI (nuclei, blue). Conditions like 1a at 29°C. Images are representative of two independent experiments with similar results. scale bar: 50μm. c, Mitotic division counts of proliferating ISCs in the midgut of Ore R flies with anti-PhoshoHistone-3 (pH3) staining (conditions like Fig.1b). n=29 xDunn’s Kruskal-Wallis test : p=0.02 (Rec. d2 vs Rec. d4). Black dots indicate counts per gut. d, Expression levels of Ace in Ore R guts. Normalized to Homeostasis. n=3 biologically independent samples per condition (two-tailed t-test, p=0.0011). e-f, Experimental design and graphs of pH3+ counts from control (myo1ATS>dCas9VPR) and flies with Ace conditionally overexpressed in ECs (myo1ATS>dCas9VPR, gRNA-Ace). Conditional perturbations with temperature-sensitive Gal4 inhibitor, Tubulin-Gal80TS(TS), allow Gal4 expression only >27°C. control: n=18(Homeostasis),19(Injury), 20(Recovery), 15(Homeostasis d12), 16(Injury 2x), 18(Recovery 2x) guts ; gRNA-Ace: n=17(Homeostasis), 18(Injury), 20(Recovery),14(Homeostasis d12),19(Injury 2x), 20(Recovery 2x) guts, from 3 independent experiments. Sidak’s and Tukey’s two-way Anova. g, Assay illustration and color-coded sequential frames of midgut before (t25) and after (t250) ACh administration of flies conditionally expressing the Ca2+ reporter GCAMP7c with the EC-driver mex1-Gal4 (mexTS >GCaMP7c) and flies overexpressing Ace (mexTS >GCaMP7c+dCas9VPR,gRNA-Ace, Videos S1-S3). Recovery: 2 days in standard food (29°C) after 4 days of DSS-feeding (23°C). Homeostasis: conditions like Recovery without DSS-feeding. Accompanying graph: average relative fluorescence intensity (ΔF/F0) per frame (5 sec/frame) and genotype. n=7 (Homeostasis), n=7 (Recovery d2), n=5 (Recovery d2, mexTS> gRNA-Ace) guts, from 3 independent experiments. Tukey’s two-way Anova. Individual ΔF/F0 shown on Ext. Data Fig.2i. scale bar: 50μm *: 0.05>p>0.01, **: 0.01<p<0.001, ***: p<0.001, ns: non-significant. Data are presented as mean values ± SEM. Illustrations with Biorender.com
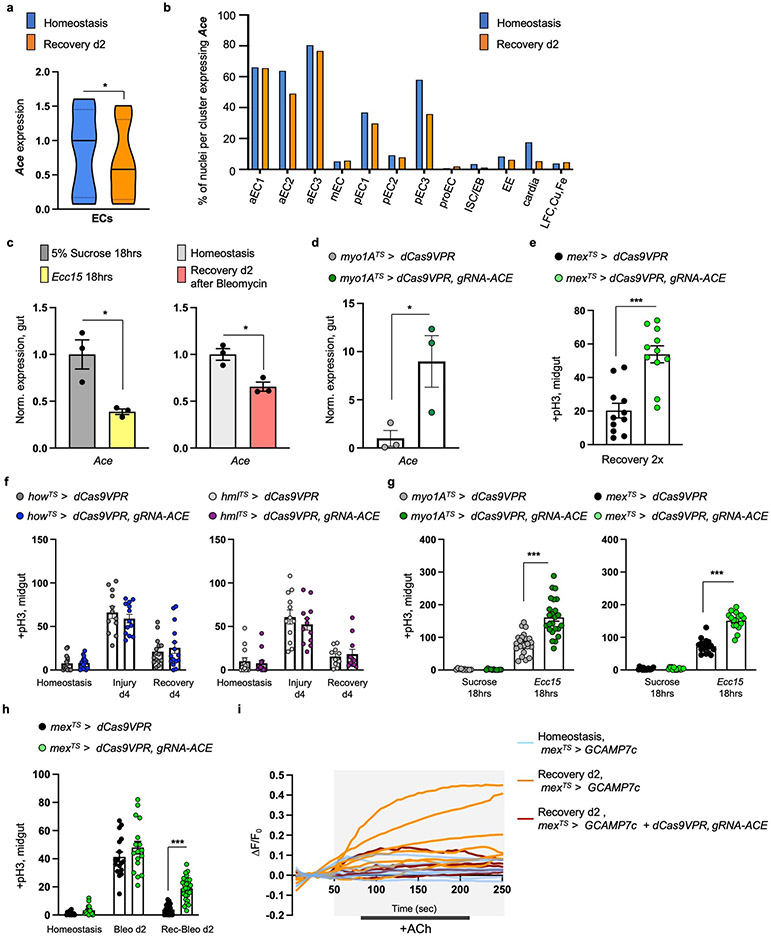
To search for recovery-specific differentially expressed genes, we performed snRNAseq on the 2nd day of recovery (Ext. Data Fig.1c). We identified 14 clusters from 8073 nuclei recovered, which we assigned to different epithelial and progenitor cell populations, as well as to cardia and LFC/Cu/Fe gut cells (Ext. Data Fig.1c-e). We analyzed differential gene expression between homeostasis and recovery and observed that Ace, is highly enriched in ECs and significantly downregulated during recovery (Ext. Data Fig.1f, Ext. Data Fig.2a-b, S. Table 1-2). Ace hydrolyzes ACh to choline and acetate and thus defines a cell’s sensitivity to ACh.
We observed ~75% reduction of Ace during recovery (Fig.1d). Previous intestinal RNA-seq profiling after bacterial infections also detected Ace downregulation (Flygut-EPFL data)19, which we confirmed (Ext. Data Fig.2c). Next, we challenged the gut with injury-inducing chemical Bleomycin which triggers different pathways as compared with DSS20. This led to significant Ace decrease (Ext. Data Fig.2c), indicating that Ace downregulation occurs consistently after different types of intestinal epithelial damage.
To test the role of Ace during regeneration, we used CRISPR/Cas9 activation (Ext. Data Fig.2d). We found that 4 days of Ace overactivation in ECs (using the Gal4 myo1A-driver together with the repressor Tubulin-Gal80TS, referred as myo1ATS) led to excessive ISC proliferation during recovery (Fig.1e), while same activation during homeostasis or injury did not affect proliferation (Fig.1e). Similarly, consecutive DSS challenges while Ace is conditionally overexpressed in ECs using the myo1ATS or mexTS driver (another EC driver) led to recovery-specific ISC over-proliferation (Fig.1f, Ext. Data Fig.2e). We next tested if Ace perturbations in visceral muscle or immune cells regulate ISC proliferation, which they did not (Ext. Data Fig.2f). These findings reveal that overexpressing Ace in ECs during recovery prevents ISCs from becoming quiescent, causing an excessive regenerative response. We next tested whether the role of Ace during recovery is consistent after different types of epithelial damage. Overexpressing Ace in ECs after Ecc15 infection or Bleomycin-injury consistently caused over-proliferation (Ext. Data Fig.2g-h).
ACh has been proposed to modulate ion transport in the intestinal epithelium in a Ca2+-dependent manner10. Thus, to test for epithelial changes in ACh sensitivity during homeostasis and recovery, we visualized Ca2+ by conditionally expressing the Ca2+ indicator GCAMP7c21 in ECs. Using ex vivo live imaging, we found that Ca2+ levels in ECs are significantly higher during recovery following ACh administration than during homeostasis and that this is attenuated upon overexpression of Ace (Fig.1g, Ext. Data Fig.2i and Videos S1-S3). These results indicate that during recovery ECs become more sensitive to ACh by decreasing Ace and this change is required for transition to homeostasis after injury.
nAChRβ3 is required in ECs for recovery
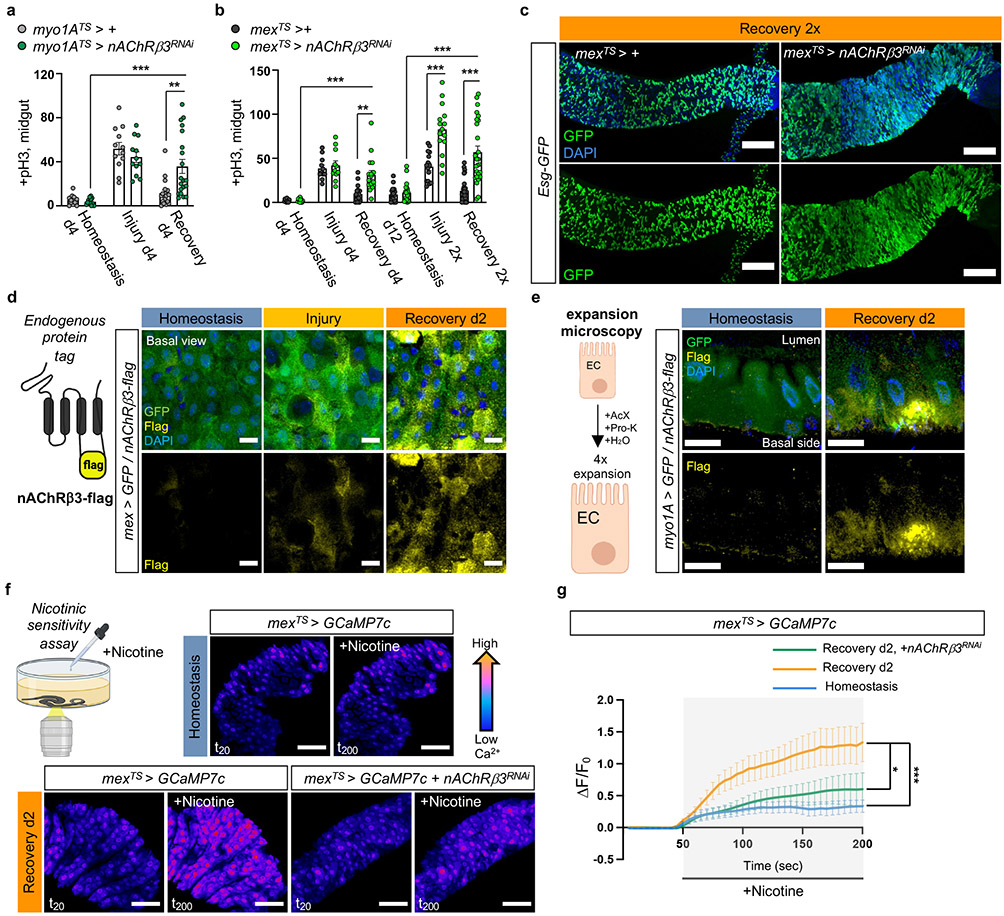
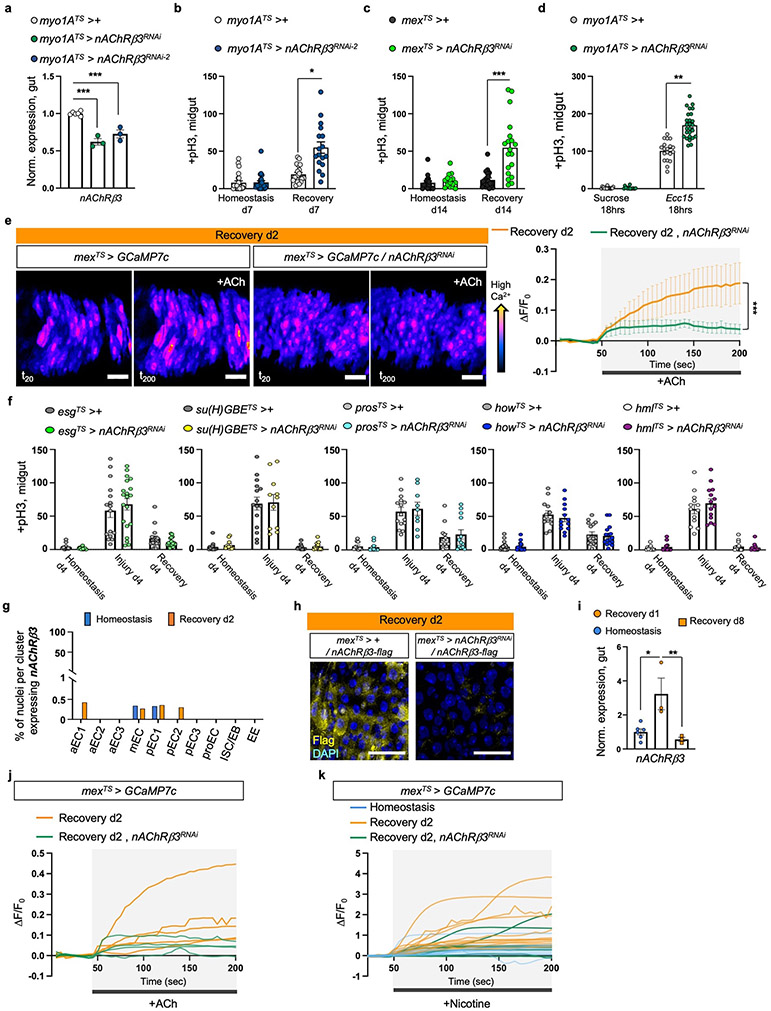
Cholinergic receptors are G-protein-coupled muscarinic receptors (mAchR) or ligand-gated ion channel nicotinic receptors (nAChR) made of five homomeric or heteromeric subunits (α1, α2, α3, α4, α5, α6, α7, β1, β2 or β3). To identify which cholinergic receptor becomes activated during recovery, we screened all nAChR subunits and different mAchR subtypes by knocking down their expression in ECs. Conditional RNAi expression targeting nAChRβ3 in ECs caused over-proliferation during recovery (Fig.2a-b, Ext. Data Fig.3a-c) and after Ecc15 infection (Ext. Data Fig.3d). Furthermore, nAChRβ3 knockdown in ECs combined with repeated DSS-injury (Recovery 2x) led to hyperplasia (Fig.2b-c). Conditional knockdown of nAChRβ3 in ECs significantly reduced the Ca2+ response after ACh administration during recovery (Ext. Data Fig.3e, Ext. Data Fig.3j). Together, these data suggest that reducing nAChRβ3 in ECs leads to phenotypes resembling Ace upregulation. This effect is specific to ECs, as conditionally knocking down nAChRβ3 in PCs, EBs alone, EEs, visceral muscle or hemocytes had no effect on proliferation (Ext. Data Fig.3f).
Fig.2 ∣. nAChRβ3 is required in ECs for recovery.
a, pH3+ counts from midgut of control (myo1ATS > +) and flies with nAChRβ3 conditionally reduced in ECs (myo1ATS> nAChRβ3RNAi). control: n=13 (Homeostasis), n=12(Injury), n=18(Recovery) guts, myo1ATS>nAChRβ3RNAi: n=13 (Homeostasis), n=12(Injury), n=20 (Recovery) guts, from 2 independent experiments. Sidak’s and Tukey’s two-way Anova. Like Fig. 1e. b, pH3+ counts from midgut of control (mexTS > +) and flies with nAChRβ3 conditionally reduced in ECs (mexTS>nAChRβ3RNAi). control: n=12 (Homeostasis), n=11(Injury), n=18(Recovery), n=20(Homeostasis d12), n=15(Injury 2x), n=29 (Recovery 2x); mexTS>nAChRβ3RNAi: n=12 (Homeostasis), n=11 (Injury), n=17 (Recovery), n=20 (Homeostasis d12), n=15 (Injury 2x), n=26(Recovery 2x), from 3 independent experiments. Sidak’s and Tukey’s two-way Anova. Like Fig. 1e-f. c, Confocal gut images of mexTS>+ and mexTS>nAChRβ3RNAi flies co-expressing the PC marker esg-GFP (green, anti-GFP, like Fig. 2b). scale bar: 100μm. Images are representative of 2 independent experiments with similar results. d, Illustration of nAChRβ3-flag and confocal images of midgut expressing nAChRβ3-flag and GFP-expressing ECs (mex >GFP). anti-Flag: nAChRβ3-flag (yellow), anti-GFP: ECs (green). scale bar: 10μm. Images are representative of 3 independent experiments with similar results. Like Fig. 1e. e, Illustration followed by images of expanded midguts from flies expressing nAChRβ3-flag (yellow) and GFP-expressing ECs (myo1A >GFP, green). scale bar: 50μm. Images are representative of 2 independent experiments with similar results. f-g, Illustration and color-coded sequential frames of midgut before (t20) and after (t200) nicotine administration of mexTS > GCaMP7c and mexTS > GCaMP7c+nAChRβ3RNAi flies (Videos S4-S6). Bottom graph: average relative fluorescence intensity (ΔF/F0) per frame (5 sec/frame) per condition and genotype. n=7(Homeostasis),n=7(Recovery d2),n=5 (Recovery d2, mexTS>Ace) guts from 2 independent experiments. Tukey’s two-way Anova (Rec d2 vs Rec d2+nAChRβ3RNAi, p=0.0116). Like Fig 1g. scale bar: 50μm. Individual ΔF/F0 on Ext. Data Fig.3k. DAPI: nuclei. *: 0.05>p>0.01, **: 0.01<p<0.001, ***: p<0.001. Mean ± SEM. Illustrations with Biorender.com
The profiling depth of our snRNAseq was not sufficient to conclude if nAChRβ3 expression is altered between homeostasis and recovery, despite being solely found in ECs (Ext. Data Fig.3g). To visualize the expression of nAChRβ3, we inserted a Flag tag within nAChRβ3 (nAChRβ3-flag) (Fig.2d, Ext. Data Fig.3h). Endogenous nAChRβ3 was significantly enriched in ECs by day 2 of recovery (Fig.2d), whereas a decrease in nAChRβ3 levels coincided with return to homeostasis (Ext. Data Fig.3i). nAChRβ3 was localized to the basal side of ECs and some ECs had more nAChRβ3 clustered on their basal side (Fig.2d-e).
Next, we administered the cholinergic agonist nicotine, which activates nAChRs and cannot be hydrolyzed by Ace. Nicotine administration significantly increased Ca2+ in ECs during recovery compared to homeostasis, reminiscent of ACh-sensitivity, and this was diminished when nAChRβ3 was knocked down (Fig.2f-g, Ext. Data Fig.3k and Videos S4-S6). We conclude that nAChRβ3 in ECs is essential for gut recovery and recovery-specific enrichment of nAChRβ3 provides an additional level of regulation that likely renders ECs more responsive to ACh while the epithelium transitions to homeostasis.
nAChRβ3-mediated Ca2+ promotes recovery
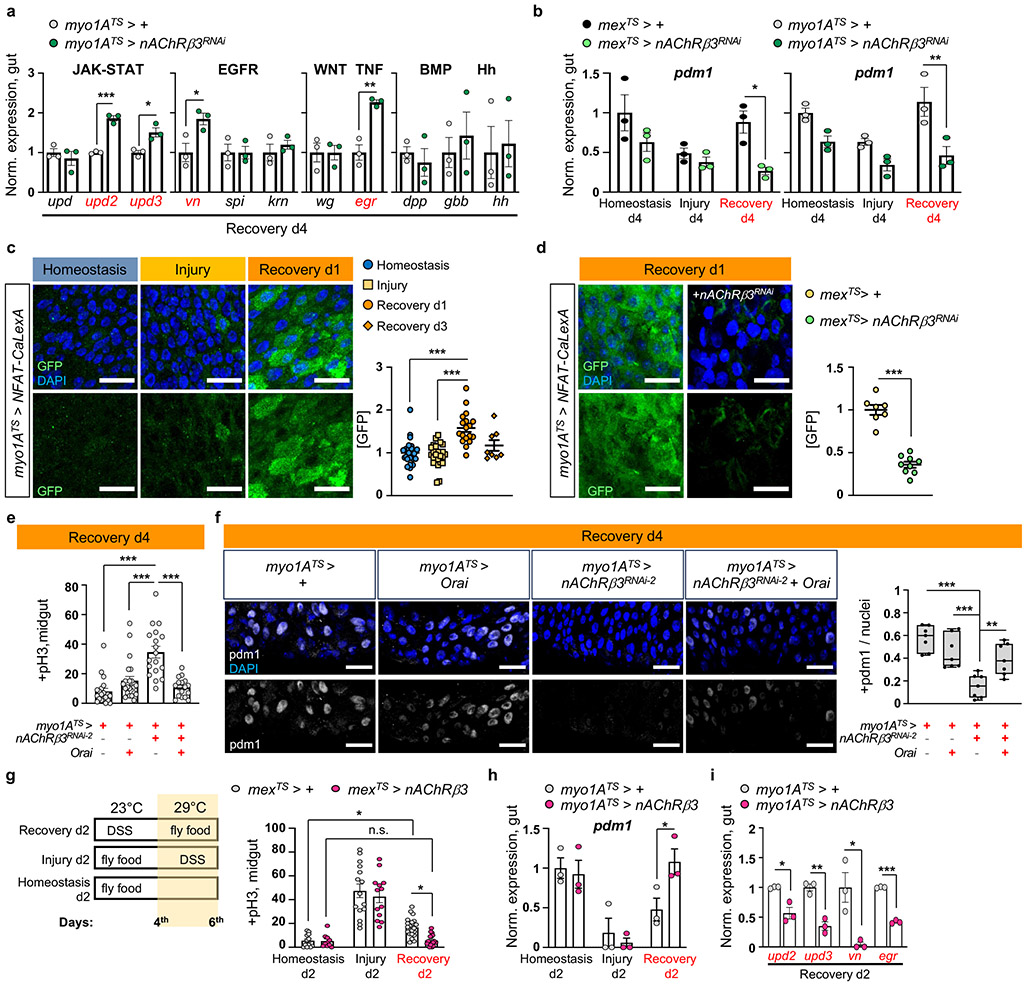
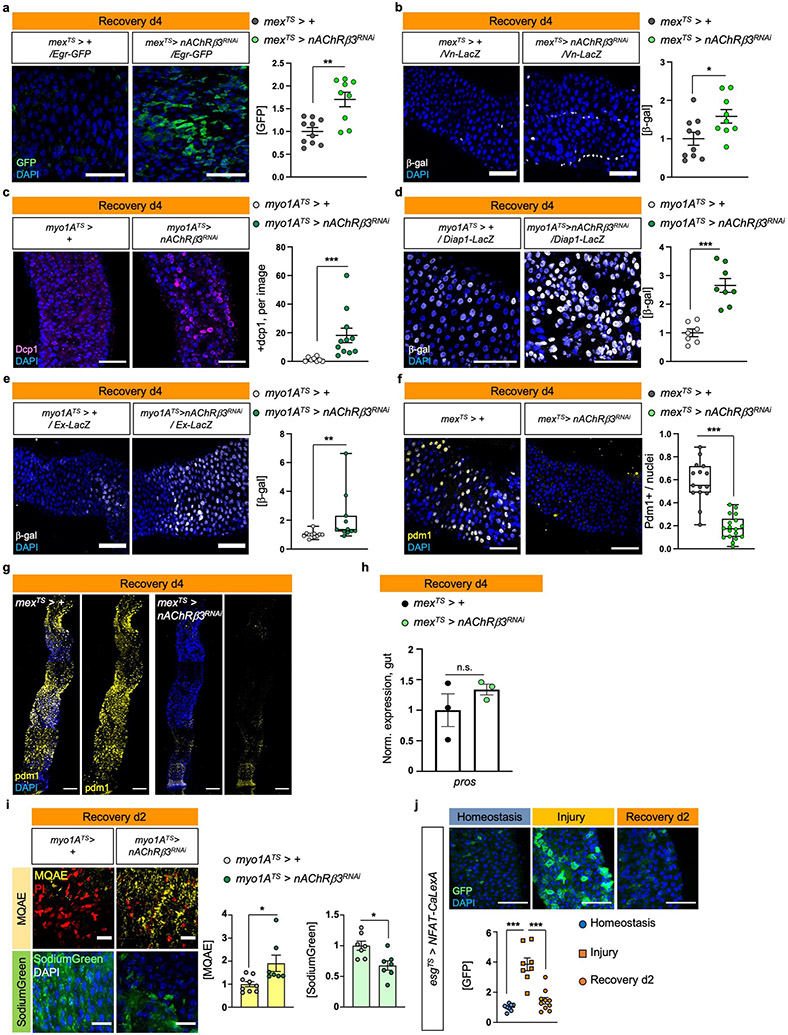
ISC proliferation can be triggered by the release of cytokines which vary depending on the stimulus15. To identify pathways responsible for unrestrained proliferation during recovery after nAChRβ3 knockdown in ECs, we tested the expression of known cytokines (Fig.3a, Ext. Data Fig.4a-b). We detected unpaired 2 (upd2) and upd3 JAK-STAT ligands, together with EGF-like ligand vein (vn) and egr, to be significantly upregulated (Fig.3a, Ext. Data Fig.4a-b). Egr is associated with cell death22, whereas Upd2, Upd3 and Vn are up-regulated on activation of the Hippo pathway effector Yorkie (Yki/YAP) in damaged ECs23,24. Supporting this, knocking down nAChRβ3 in ECs during recovery significantly increased cell death (Ext. Data Fig.4c) as well as expression of Yki targets Diap1 and Ex (Ext. Data Fig.4d-e). Also, knockdown of nAChRβ3 during recovery significantly reduced the transcript and protein levels of pdm1 (Fig. 3b, Ext. Data Fig.4f-g), while pros remained unchanged (Ext. Data Fig.4h). These data suggest that disruption of nAChRs in ECs during recovery impairs ECs, leading to cell death, Yki activation and subsequent production of inflammatory signals that induce unwarranted ISC proliferation.
Fig.3 ∣. nAChRβ3-mediated Ca2+ promotes recovery.
a, Cytokine expression levels when reducing nAChRβ3 in ECs (myo1ATS>nAChRβ3RNAi). Like Fig. 1e. upd(unpaired), vn(vein), spi(spitz), krn(keren), wg(wingless), dpp(decapentaplegic), gbb(glass bottom boat), hh(hedgehog). n=3 biologically independent samples per genotype. Sidak’s two-way Anova; p=0.0196(vn), p=0.0022 (egr). b, Pdm1 levels when reducing nAChRβ3 in ECs (mexTS>nAChRβ3RNAi and myo1ATS>nAChRβRNAi). Like Fig. 1e. n=3 biologically independent samples per genotype and condition. Sidak’s two-way Anova; p=0.0014 (Rec.d4, myo1ATS>+ vs myo1ATS>nAChRβ3RNAi), p=0.0142 (Rec.d4, mexTS>+ vs mexTS>nAChRβ3RNAi). c, Posterior midgut with Ca2+ reporter in ECs (myo1ATS>NFAT-CaLexA). Reporter expression: 2days (29°C) per condition. GFP: green(Ca2+). Graph: GFP per image and condition. n=25(Homeostasis), n=24(Injury),n=18(Rec.d1), n=8(Rec.d3) guts from 3 independent experiments (Dunn’s Kruskal-Wallis test). d, Posterior midgut with NFAT-CaLexA in control (mexTS>NFAT-CaLexA) and when reducing nAChRβ3 in ECs (mexTS>NFAT-CaLexA+nAChRβ3RNAi). Conditions: 4days DSS-food (23°C) and standard food for 24hrs (29°C). n=7(control), n=9(nAChRβ3RNAi) guts from 2 independent experiments (two-tailed t-test). e, pH3+ counts from Orai (Ca2+ channel) overexpression (myo1ATS>Orai), nAChRβ3 reduction (myo1ATS>nAChRβ3RNAi-2) and combined (myo1ATS>nAChRβ3RNAi+Orai) in ECs. Like Fig 1e. n=20(control), n=22(Orai), n=18(nAChRβ3RNAi2), n=16(nAChRβ3RNAi +Orai) guts, from 3 independent experiments (Dunn’s Kruskal-Wallis test). f, Posterior midgut stained with anti-pdm1(grey), like Fig. 3e. Boxplot: pdm1+ versus all nuclei per image (median, quartiles, whiskers: minimum maximum values). N=7 guts per genotype (Tukey’s one-way Anova, Orai vs nAChRβ3RNAi + Orai: p=0.0092), from 2 independent experiments. g, Experimental design and pH3+ counts when nAChRβ3 is overexpressed in ECs (mexTS>nAChRβ3). control: n=12(Hom.), n=15(Injury), n=21(Rec.d2) guts, mexTS>nAChRβ3: n=8(Hom.), n=13(Injury), n=18(Rec.d2) guts from 2 independent experiments. Two-way Anova: p=0.023 (Rec. d2: control vs mexTS>nAChRβ3), p=0.0396 (control: Hom. vs Rec.d2). h-i, Pdm1 and cytokine levels from myo1ATS>nAChRβ3 flies. Like Fig. 3g. n=3 biologically independent samples per genotype. Sidak’s two-way Anova (pdm1/Rec.d2: p=0.0415, upd2: p=0.0326, upd3: p=0.0014, egr: p=0.0037). DAPI: nuclei. scale bars: 20μm. *: 0.05>p>0.01, **: 0.01<p<0.001, ***: p<0.001. n.s.: non-significant. Mean ± SEM.
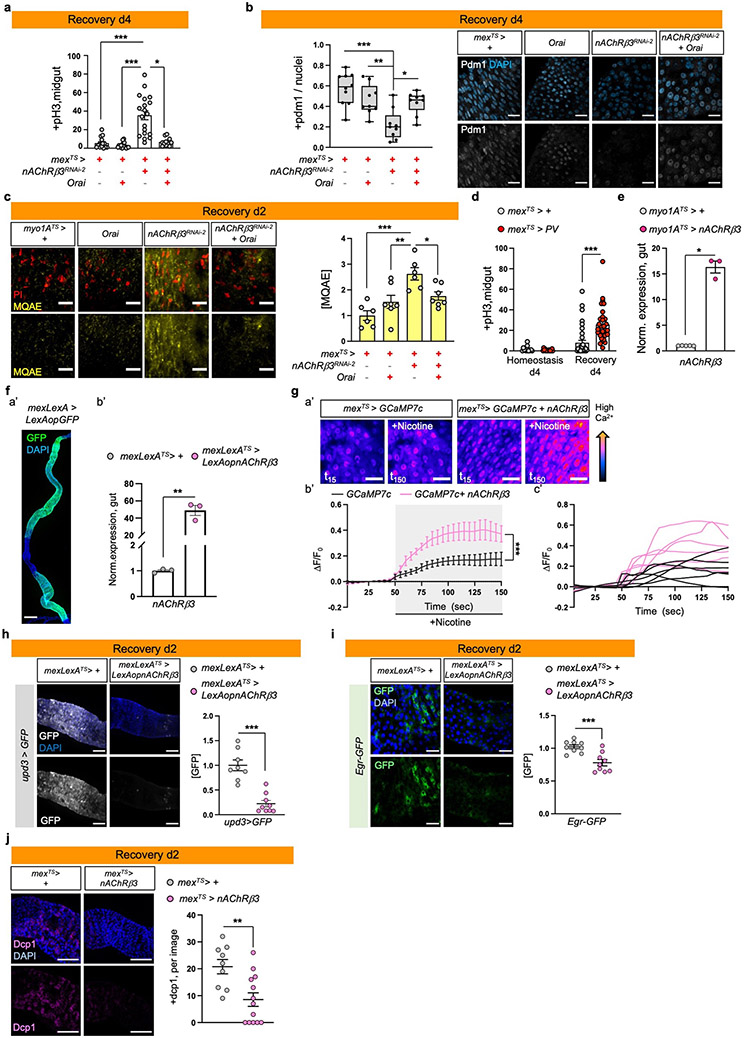
Cholinergic receptors regulate ion transport in the mammalian epithelium10,25. We asked whether nAChRs have similar functions in ECs using dyes that detect Na+ (SodiumGreen) or Cl− (MQAE), and the Ca2+ transcriptional reporter NFAT-CalexA26. Reduction of nAChRβ3 during recovery caused significant ion imbalance in the epithelium, with reduced Cl− and Na+ levels (Ext. Data Fig.4i). We observed that Ca2+ is significantly upregulated the first day of recovery before returning to levels resembling homeostasis (Fig.3c). This endogenous Ca2+ increase disappears when nAChRβ3 is knocked down in ECs (Fig.3d). Also, Ca2+ increase occurs only in ECs during recovery, as ISCs that use Ca2+ for proliferation27,28 show Ca2+ decline during recovery (Ext. Data Fig.4j). To examine the importance of nAChR-mediated Ca2+ during recovery, we genetically compensated for Ca2+ in nAChRβ3-deficient ECs. Conditional overexpression of Ca2+ channel Orai combined with knockdown of nAChRβ3 in ECs was sufficient to restore i) ISC proliferation (Fig.3e, Ext. Data Fig.5a), ii) the number of pdm1+ ECs (Fig.3f, Ext. Data Fig.5b), and iii) Cl− (Ext. Data Fig.5c) to levels identical to controls. Next, we over-expressed the vertebrate Ca2+ buffer protein parvalbumin (PV) in ECs to reduce the amount of intracellular Ca2+ for four days during recovery (Ext. Data Fig.5d). This led to over-proliferation during recovery while having no effect during homeostasis (Ext. Data Fig.5d), supporting the importance of Ca2+ in ECs during recovery.
To further study the effect of nAChRβ3 during gut regeneration, we generated flies that overexpress nAChRβ3 in ECs using the Gal4 or LexA system (UAS- nAChRβ3 and LexAop-nAChRβ3, Ext. Data Fig.5e-f). Also, we generated an EC-LexA driver (mex-LexA::GAD) together with Tubulin-Gal80TS, referred as mexLexATS (Ext. Data Fig.5f). Conditionally overexpressing nAChRβ3 in ECs during homeostasis doubles the amount of Ca2+ in ECs after nicotine administration (Ext. Data Fig.5g). Also, nAChRβ3 overexpression in ECs significantly expedited recovery, with ISC proliferation and pdm1 expression reaching levels indistinguishable from unchallenged guts at two days, half the expected time (Fig.3g-h). nAChRβ3 overexpression in ECs during homeostasis and injury did not change ISC proliferation (Fig.3g). Additionally, overexpressing nAChRβ3 in ECs during recovery significantly reduced inflammatory cytokine levels and cell death (Fig.3i, Ext. Data Fig.5h-j).
Together, our data show that high intracellular Ca2+ in ECs triggered by nAChRs control intestinal epithelium recovery by promoting EC maturation and ion balance. Disruption of nAChR-mediated Ca2+ causes EC deficiency, ion imbalance, elevated cell death and Yki activation, followed by over-inflammation and over-proliferation. In contrast, increasing Ca2+ in ECs via overexpressing nAChRβ3 expedites return to homeostasis by advancing EC maturation and decreasing cell death, subsequently reducing inflammation and proliferation.
Neuro-EC interactions promote recovery
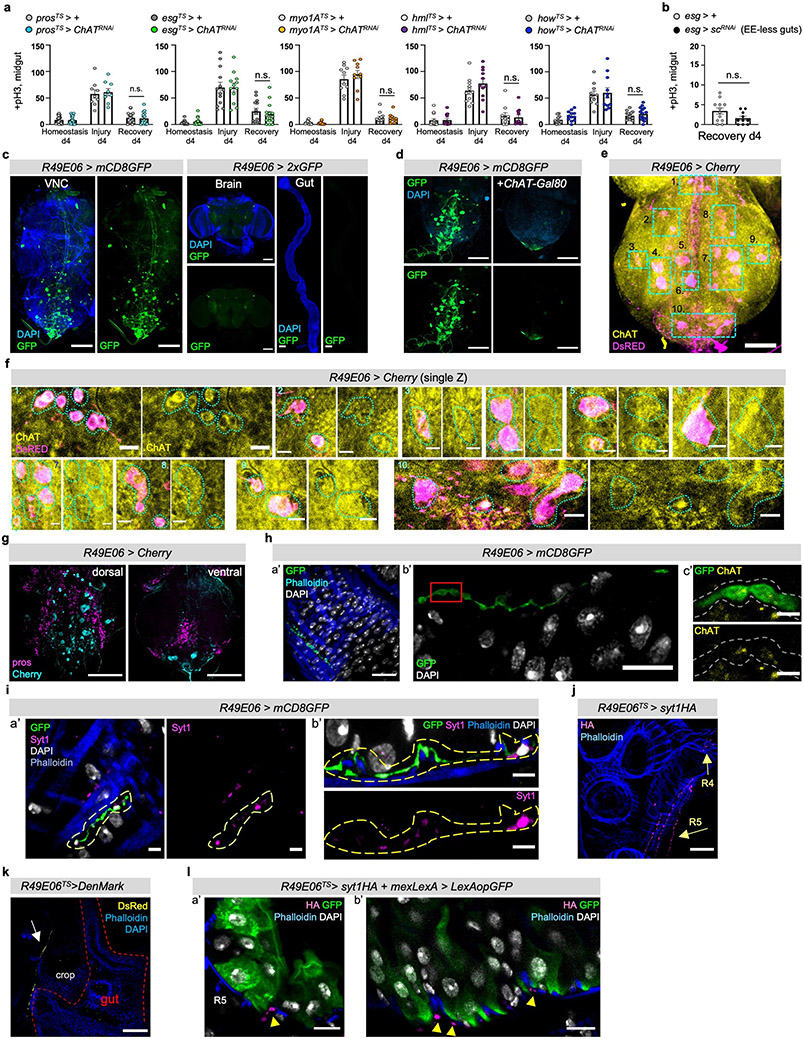
ACh is released by neuronal and non-neuronal cells that express ChAT (Choline acetyltransferase), the enzyme that catalyzes ACh synthesis3. To identify the source of ACh responsible for nAChR-mediated recovery, we first tested midgut cells (PCs, ECs, EEs), the visceral muscle and immune cells (hemocytes). ISC proliferation during recovery remained unaffected when ChAT was conditionally knocked down in these cells (Ext. Data Fig.6a). Similarly, EE-less guts29 do not over-proliferate during recovery (Ext. Data Fig.6b). Altogether, these data point to a neuronal source of ACh. The importance of neurons during regeneration has been reported in different tissues30. For the gut, studies have highlighted the anti-inflammatory properties of mammalian enteric neurons31,32, while limited associations have been made between neurons and ISC proliferation in Drosophila33,34.
Since ACh is a short-distance neurotransmitter/local neurohormone, the most likely source during recovery is the enteric nervous system. Drosophila enteric neurons innervate the midgut in anterior (R1, R2) and posterior regions (R4, R5), even though their cell bodies reside in the brain, hypocerebral ganglion (HCG), or the adult ventral nerve cord (VNC)2. Also, enteric innervations reach the intestinal epithelium34. To identify a driver for cholinergic enteric neurons, we screened a set of neuronal drivers (FlyLight)35. We identified a Gal4 driver, R49E06-Gal4, that is expressed in ~43 neurons in the abdominal ganglion of the VNC (Ext. Data Fig.6c-g), has no expression in the gut, and very limited expression in the brain (Ext. Data Fig.6c&FlyLight). We tested the cholinergic nature of R49E06-neurons using the cholinergic Gal80 repressor (ChAT-Gal80), which inhibited GFP expression in most VNC R49E06-neurons (Ext. Data Fig.6d). We found that ~35 of the ~43 neurons in the abdominal ganglia are ChAT+/cholinergic (Ext. Data Fig.6e-f) and in their majority do not express Prospero (Pros, Ext. Data Fig.6g). We observed that some R49E06-neurons innervate the midgut and are ChAT+ (Ext. Data Fig.6h), suggesting that a subpopulation of R49E06-neurons are cholinergic enteric neurons. To confirm that R49E06-innervations can release ACh to the gut, we used an antibody against the synaptic vesicle membrane protein Synaptotagmin1 (Syt1) which is essential for neurotransmitter release. We observed that R49E06-innervations run between the muscle and intestinal epithelium while carrying Syt1+ swellings (Ext. Data Fig.6i). We refer to Syt1+ swellings as presynaptic boutons because they resemble en passant varicosities described in the autonomous nervous system and are located at sites where a neurotransmitter diffuses to receptors located in nearby (innervated) cells. Together these data indicate that R49E06-neurons are in their majority cholinergic and include a subpopulation of cholinergic enteric neurons that innervate the intestinal epithelium and muscle.
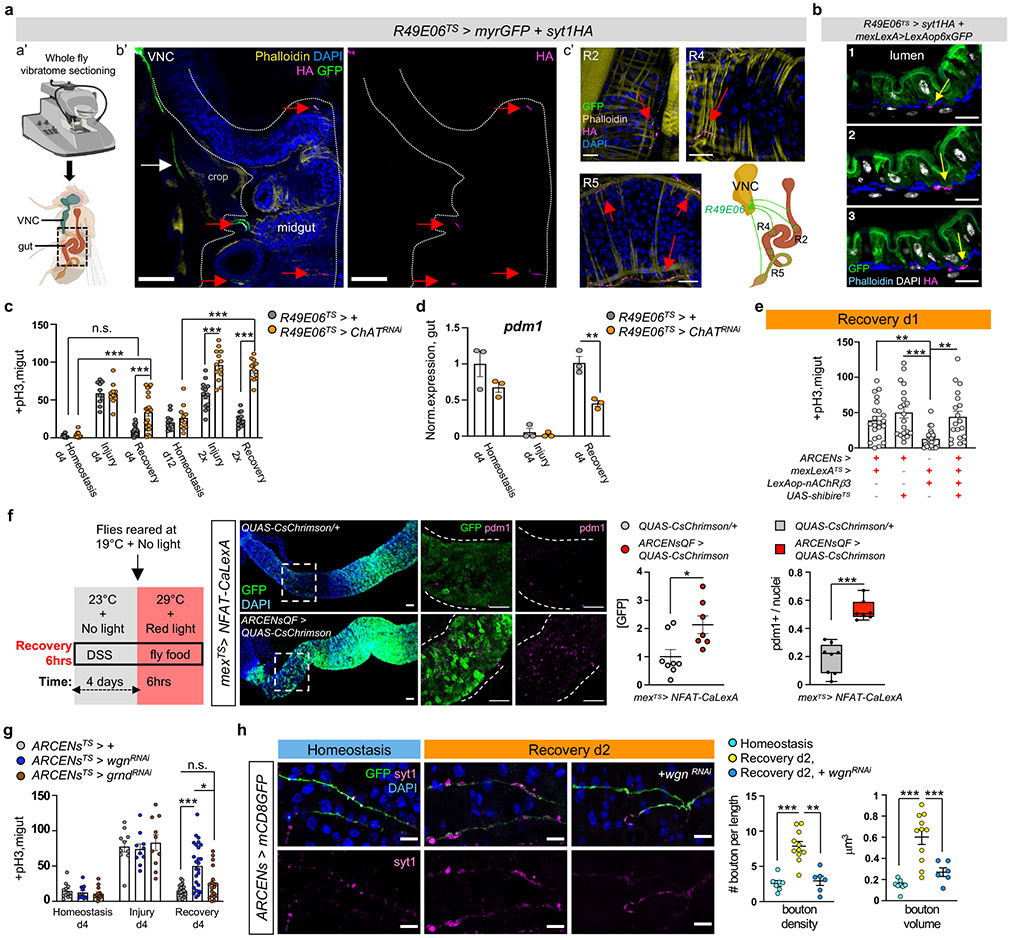
To further characterize R49E06-enteric innervations, we sectioned flies with a vibratome so that innervations and gut remained intact (Fig.4a). R49E06-neurons innervate the midgut at distinct locations in R2, R4 and R5 (Fig.4a). To distinguish between the axonal and dendritic domains, we expressed the synaptic vesicle marker Syt1HA and the dendritic indicator DenMark for two days during recovery. We observed that Syt1HA accumulated at the terminal of R49E06-innervations in the vicinity of the gut (Fig.4a, Ext. Data Fig.6j), whereas DenMark accumulated upstream (Ext. Data Fig.6k). We observed that Syt1HA-innervations are close to ECs (Fig.4b, Ext. Data Fig.6l and Video S7), suggesting that R49E06 neurons innervate ECs and could be the source of ACh.
Fig.4 ∣. ARCEN-EC interactions promote recovery.
a, Vibratome-sectioning of R49E06TS>myrGFP+syt1HA flies (Rec.d2). a’-b’: sectioned thorax/abdomen (square). white dots: midgut. White arrow: R49E06-projection. c’: innervated R2, R4, R5. anti-GFP: R49E06-innervations(green), anti-HA: presynaptic syt1HA(magenta). Red arrow: R49E06-enteric innervations. Images b’-c’ are representative of 2 independent experiments with similar results. scale bar: 100μm(b’), 20μm(c’). b, Sequential R4 images (Video S7) from R49E06TS>syt1HA+mexLexA>6xLexAopGFP flies (Rec.d2). Arrows: anti-HA(magenta), anti-GFP: ECs(green). scale bar: 10μm. Images are representative of 2 independent experiments with similar results. c, +pH3 counts when ChAT (Choline Acetyltransferase) is reduced in R49E06-neurons (R49E06TS>ChATRNAi). Control: n=10(Hom.), n=10(Injury), n=16(Rec.d4), n=13(Hom.d12), n=14 (Injury 2x),n=13(Rec.2x) guts; R49E06TS>ChATRNAi: n= 10(Hom.), n=10(Injury), n=20(Rec.d4),n=11(Hom.d12),n=13(Injury 2x),n=12(Rec.2x) guts, from 2 independent experiments (Sidak’s two-way Anova). Like Fig.1e-f. d, Pdm1 expression levels. n=3 biologically independent samples. Sidak’s two-way Anova(p=0.0027). e, +pH3 counts when overexpressing nAcRβ3 in ECs (mexLexATS>lexAop-nAcRβ3) and thermo-silencing (>27°C) R49E06/ARCENs with shibireTS (ARCENs>shibireTS). Conditions: 4days DSS-food (23°C), 24hrs standard food (29°C). n=22(control), n=20(ARCENs>shibireTS), n=24(mexLexATS>lexAop-nAcRβ3), n=19(ARCENs>shibireTS+mexLexATS>lexAop-nAcRβ3) guts from 3 independent experiments. Dunn’s Kruskal-Wallis test: p=0.0029(control vs shibireTS), p=0.0024(shibireTS+lexAop-nAcRβ3 vs shibireTS). f, Thermo- and optogenetic induction with NFAT-CalexA expressed in ECs (mexTS>NFAT-CaLexA/QUAS-CsChrimson) after depolarizing ARCENs with CsChrimson (mexTS>NFAT-CaLexA/ARCENsQF>QUAS-CsChrimson). anti-GFP: Ca2+(green), anti-pdm1: ECs(magenta). Chart: GFP fold change, Boxplot: pdm1+ ratio (median, quartiles, whiskers: minimum maximum values). n=8(control), n=7(CsChrimson) guts from two independent experiments, two-tailed Mann-Whitney test (p=0.0205/GFP). scale bar: 50μm. g, pH3+ counts after reducing TNF receptors in ARCENs (wgn/wengen, ARCENsTS>wgnRNAi ; grnd/grindelwald, ARCENsTS>grndRNAi). control: n=12(Hom.), n=10(Injury), n=21(Rec.); wgnRNAi: n=12(Hom.), n=10(Injury), n=25(Rec.); grndRNAi: n=14(Hom.), n=10(Injury), n=19(Rec.) guts from 2 independent experiments. Dunn’s Kruskal-Wallis test: p=0.0185(wgnRNAi vs grndRNAi; Rec). h, R5 of ARCENs>mCD8GFP and ARCENs>mCD8GFP+wgnRNAi guts. anti-GFP: ARCENs-innervations(green), anti-Syt1: boutons(magenta). n=8(Hom.), n=11(Rec.), n=6(wgnRNAi) guts, from 2 independent experiments. Tukey’s one-way Anova (p=0.0019, Rec. vs wgnRNAi; boutons). scale bar: 10μm. Phalloidin: muscle. DAPI: nuclei. *: 0.05>p>0.01, **:0.01<p<0.001, ***:p<0.001. n.s.: non-significant. Mean ± SEM. Illustrations with Biorender.com
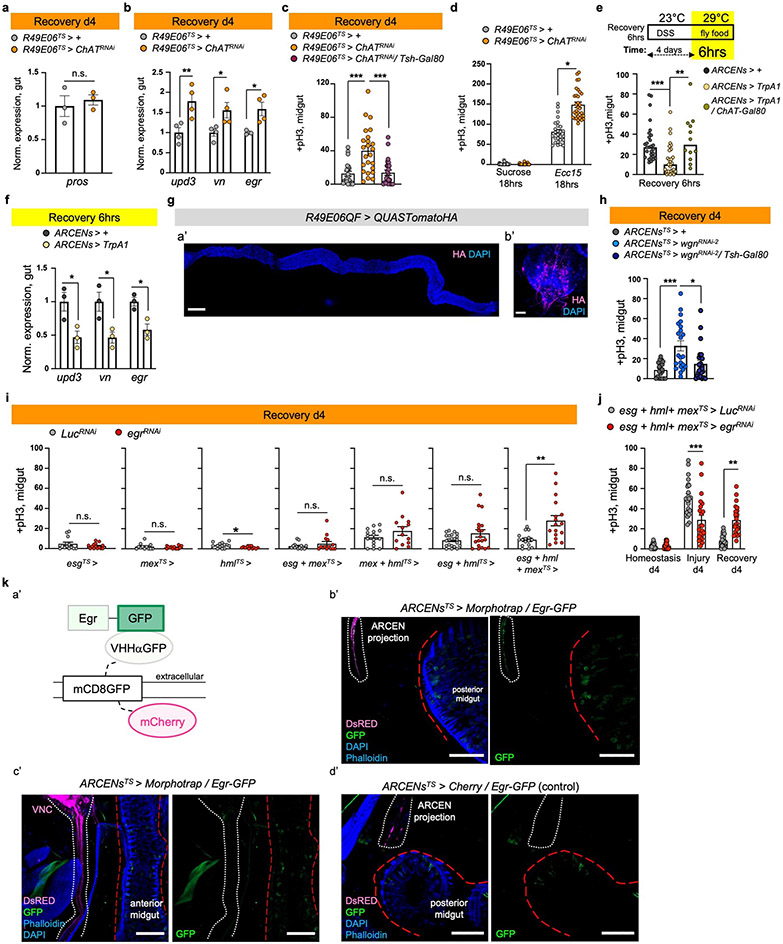
To test whether R49E06 neurons regulate gut regeneration, we conditionally knocked down ChAT in these neurons. This caused: i) over-proliferation during recovery and after repetitive DSS-injury (Fig.4c), (ii) recovery-specific reduction of pdm1 (Fig. 4d), iii) no significant change of pros (Ext. Data Fig.7a), and iv) elevated expression of inflammatory cytokines during recovery (Ext. Data Fig.7b). Also, co-expression of the VNC repressor Tsh-Gal8036, while reducing ChAT in R49E06-neurons, prevented ISC over-proliferation during recovery (Ext. Data Fig.7c). Further, ChAT decrease in R49E06 neurons led to ISC over-proliferation after Ecc15 infection (Ext. Data Fig.7d). Thus, reduction of ACh synthesis from R49E06-neurons in VNC leads to lasting unresolved injury, resembling nAChRβ3-deficiency in ECs. These data indicate that intestinal repair is under neuronal control, leading us to name these neurons Anti-inflammatory Recovery-regulating Cholinergic Enteric Neurons (ARCENs).
To test whether ARCENs are required for nAChR-mediated recovery, we blocked neurotransmitter release with the UAS-shibireTS transgene while simultaneously overexpressing nAChRβ3 (Fig.4e). We found that 24hr expression of shibireTS in ARCENs was sufficient to prevent nAChRβ3 overexpression in ECs from rapidly decreasing proliferation (Fig.4e). To verify that ARCENs release ACh to the intestinal epithelium, we overexpressed the ion channel TrpA1 and thermo-genetically depolarized ARCENs (Ext. Data Fig.7e). TrpA1-mediated induction of ARCENs the first 6 hours of recovery significantly reduced ISC proliferation, whereas additionally expressing the cholinergic repressor ChAT-Gal80 restored proliferation to levels identical to controls (Ext. Data Fig.7e). Also, TrpA1-induction of ARCENs significantly reduced the expression of gut inflammatory cytokines (Ext. Data Fig.7f). Moreover, we used the QF system to generate R49E06-QF (ARCEN-QF) driver (Ext. Data Fig.7g). We used ARCEN-QF together with light-gated cation channel CsChrimson to depolarize ARCENs while conditionally expressing in ECs the Ca2+ transcriptional reporter NFAT-CaLexA (Fig.4f). Optogenetic activation of ARCENs the first 6 hours of recovery was sufficient to significantly increase endogenous Ca2+ and levels of pdm1+ ECs (Fig.4f). Together, these data support that ARCENs provide ACh to ECs to promote transition to homeostasis after injury by activating nAChR-mediated Ca2+ influx, increasing mature ECs, reducing proliferation, and decreasing inflammation in the intestinal epithelium. However, we cannot completely rule out that the subpopulation of ARCENs without enteric innervations may have mediator roles that promote recovery by activating non-ARCEN cholinergic enteric innervations. Our findings demonstrate nerve-dependent intestinal regeneration, placing the intestinal epithelium among the tissues whose ability to regenerate depends on neurons.
ARCENs depend on TNF signaling
The cholinergic anti-inflammatory reflex has been proposed to sense inflammatory signals like TNF and reduce them by triggering ACh release across neuro-immune interactions11,37. As Drosophila peripheral neurons have been reported to respond to Egr through wengen (wgn)38, one of the two known Egr receptors (wgn and grindelwald, grnd)39,40, we tested whether the protective role of ARCENs is linked to Egr. Reduction of wgn but not grnd in ARCENs led to significant ISC over-proliferation specifically during recovery, which was rescued when Tsh-Gal80 was co-expressed (Fig.4g, Ext. Data Fig.7h).
We searched for the source of TNF signaling by conditionally knocking down egr in gut and immune cells (Ext. Data Fig.7i). Reduction of egr in PCs and ECs did not impact ISC proliferation during recovery and knocking down egr in hemocytes caused under-proliferation (Ext. Data 7i). However, decreasing egr in all three populations concurrently caused significant over-proliferation during recovery (Ext. Data Fig.7i-j). This suggests that ARCENs likely sense Egr from multiple sources. Also, knocking down egr in all three cell populations during injury caused ISC under-proliferation (Ext. Data Fig.7j), consistent with the proposed proliferative role of Egr41.
Further, we tested whether secreted Egr reaches ARCENs. We expressed in the transmembrane of ARCENs an extracellular nanobody-based GFP trap (morphotrap)42 for two days during recovery while endogenous Egr was fused to GFP (Egr-GFP). We observed GFP accumulation in ARCEN-projections expressing the morphotrap (Ext. Data Fig.7k), indicating that secreted Egr reaches ARCENs. GFP accumulation was only observed in ARCEN-projections near the posterior midgut and not near the VNC (Ext. Data Fig.7k). Since near the posterior midgut ARCEN-innervations are enriched with dendritic sites (Ext. Data Fig.6k), this raises the possibility that wgn receptors are present in this region and ARCENs likely sense Egr through their enteric projections during recovery. As TNF has been proposed to promote synaptic plasticity and strengthening43 and axonal strengthening is associated with elevated firing44, we examined whether existing synaptic boutons of ARCEN-innervations undergo Egr-dependent changes (Fig.4h). ARCEN-innervations undergo significant increase in density and volume of synaptic boutons during recovery compared to homeostasis (Fig. 4h). This increase is diminished upon wgn reduction (Fig.4h), indicating that ARCEN-innervations respond to Egr by strengthening their axonal properties, likely to boost ACh release. Altogether, our data support that the function of ARCENs during gut regeneration is linked to TNF signaling, reminiscent of the cholinergic anti-inflammatory reflex37.
Ca2+ spreads via Inx2/Inx7 gap junctions
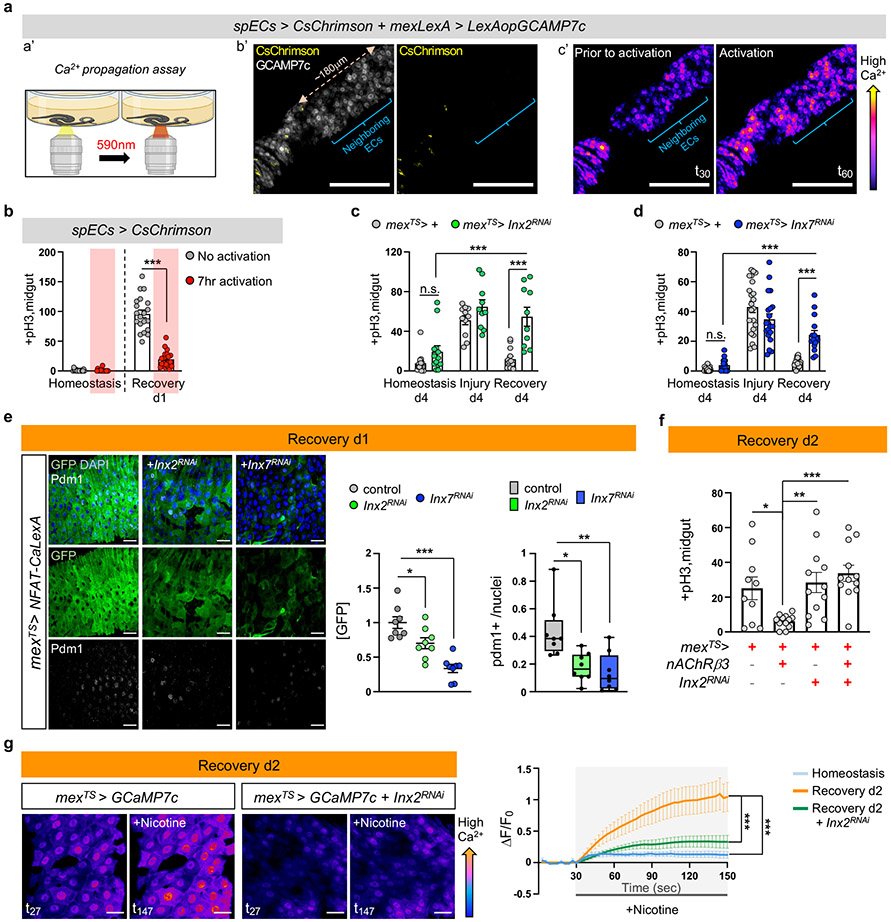
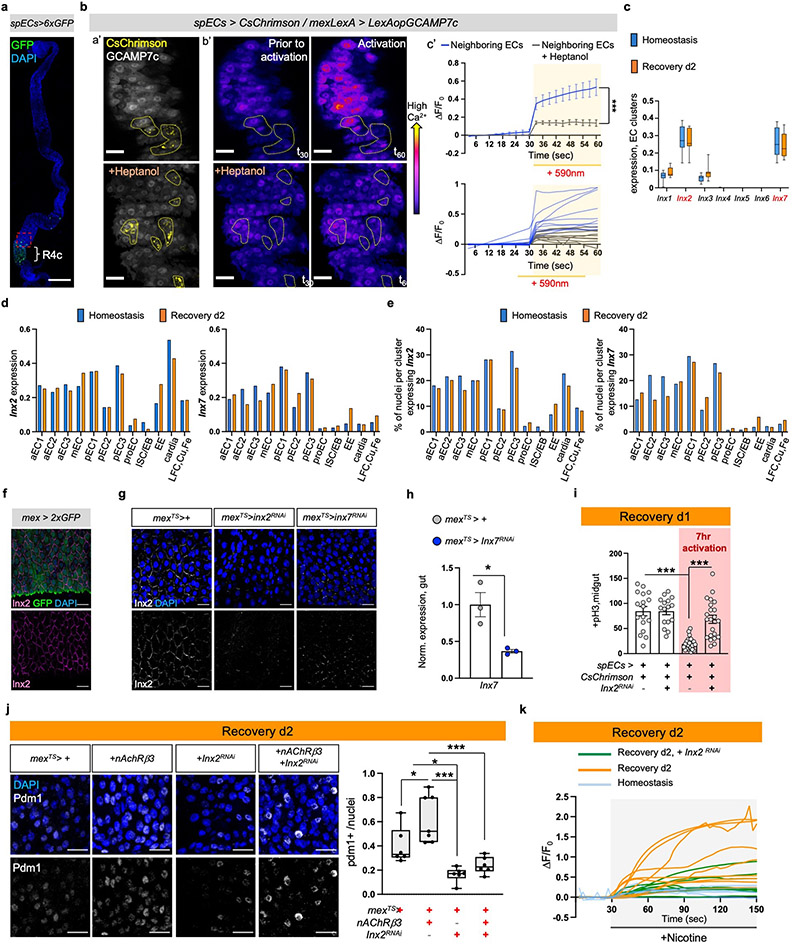
We observed that opto-activation of ARCENs led to broad Ca2+ increase across ECs in the posterior gut (Fig.4f), despite the limited innervations, suggesting that Ca2+ likely propagates between innervated and non-innervated ECs. To test this, we performed ex vivo Ca2+ live imaging utilizing split-Gal4 drivers45 that when combined are specific to a small population of ECs between R4 and R5 (R4c, Ext. Data Fig.8a), which we refer as spECs. We transiently increased Ca2+ in spECs using the light-gated CsChrimson channel, while recording Ca2+ changes in neighboring ECs (Fig. 5a, Ext. Data Fig.8b). Activation of CsChrimson in spECs increased Ca2+ in distant ECs as far as 180μm (Fig.5a, Ext. Data Fig.8b, Video S8) and the gap junction blocker Heptanol, significantly reduced Ca2+ propagation (Ext. Data Fig.8b). These data suggest that when Ca2+ is elevated in a subpopulation of ECs, gap junctions spread Ca2+ in more ECs. The endogenous flow of ions among cells (bioelectric signaling) has been proposed to regulate regeneration9,46,47. Therefore, we tested if generating Ca2+ currents via CsChrimson-activation in spECs could impact gut regeneration (Fig.5b). We found that 7hr opto-activation of spECs led to significantly faster decrease in proliferation the first day of recovery (Fig.5b), reminiscent of ARCEN activation (Ext. Data Fig.7e).
Fig.5 ∣. Ca2+ spreads via Inx2/Inx7 gap junctions.
a, a’: Experimental Illustration. b’: Posterior midgut with CsChrimson in few ECs (spECs, spEC>CsChrimson, yellow) while all ECs express GCAMP7c (mexLexA>LexAopGCAMP7c, grey). Neighboring ECs: no CsChrimson expression. c’: Color-coded sequential frames prior (t30) and during (t60) CsChrimson-activation (Video S8). Images are representative of 3 independent experiments with similar results. Quantifications: Ext. Data Fig.8b. scale bar: 100μm. b, pH3+ counts of spEC>CsChrimson during 7hr opto-activation. No activation: n=17(Hom.), 20(Rec.) ; Activation: n=16(Hom.), n=21(Rec.) guts from 3 independent experiments (two-tailed Mann-Whitney). Conditions: see Methods. c-d, pH3+ counts when reducing Inx2 (mexTS>Inx2RNAi) and Inx7 (mexTS>Inx7RNAi) in ECs. Conditions: Fig. 1e. control: n=13(Hom./c), n=23(Hom./d), n=11(Injury/c), n=22(Injury/d), n=13(Rec./c), n=16(Rec./d); Inx2RNAi: n=13(Hom.), n=10(Injury), n=10(Rec); Inx7RNAi: n=17(Hom.), n=20(Injury), n=15(Rec.) guts from 2 independent experiments (two-way Anova). e, Posterior midgut expressing NFAT-CaLexA in ECs while reducing Inx2 or Inx7 (mexTS>NFAT-CaLexA+Inx2RNAi, mexTS>NFAT-CaLexA+Inx7RNAi). anti-GFP: Ca2+(green), anti-pdm1: ECs(grey). DAPI: nuclei. Scalebar 20μm. Conditions: 4days DSS-food (23°C), 24hrs standard food (29°C). Chart: GFP fold change, Boxplot: pdm1+ ratio (median, quartiles, whiskers: minimum maximum values). n=8 guts per genotype from 2 independent experiments. Tukey’s one-way Anova (p=0.0272; control vs Inx2RNAi; GFP). Dunn’s Kruskal-Wallis test (p=0.024 control vs Inx2RNAi;pdm1+), f, pH3+ counts when overexpressing nAcRβ3 (mexTS>nAcRβ3), reducing Inx2 in ECs (mexTS>Inx2RNAi) and combined (mexTS>nAcRβ3+Inx2RNAi). Conditions: 4days DSS-food (23°C), 48hrs standard food (29°C). n=10(mexTS>+), n=12(mexTS>nAcRβ3, mexTS>Inx2RNAi, mexTS>nAcRβ3+Inx2RNAi) guts from 2 independent experiments. Tukey’s one-way Anova (p=0.0476 control vs nAcRβ3, p=0.0096 nAcRβ3 vs Inx2RNAi). g, Color-coded sequential frames while reducing Inx2 in ECs (mexTS >GCaMP7c+Inx2RNAi) before (t27) and after (t147) nicotine (Videos S9-S10). Graph: average fluorescence intensity (ΔF/F0) per frame (~3sec/fr) and genotype. Individual ΔF/F0: Ext. Data Fig.8k. n= 6(Hom.), n=9(Rec.),n=8(Inx2RNAi) guts from 2 independent experiments (Tukey’s two-way Anova). scale bar: 20μm. Conditions: Fig. 2f. n.s.:non-significant, *: 0.05>p>0.01, **: 0.01<p<0.001, ***: p<0.001. Mean ± SEM. Illustrations with Biorender.com
To investigate further how bioelectric signaling regulates gut recovery we analyzed in our single nuclei data the expression of innexins, the components of gap junctions in invertebrates6,48. Innexin2 (Inx2) and Innexin7 (Inx7) are similarly enriched in ECs whereas their expression in PC and EE clusters is lower (Ext. Data Fig.8c-e). We confirmed expression in ECs using an antibody for Inx2 (Ext. Data Fig.8f). Inx7 reduction in ECs disrupted Inx2 gap junction formation (Ext. Data 8g-h), suggesting that Inx2 and Inx7 form heteromeric gap junctions. Moreover, knocking down Inx2 or Inx7 in ECs led to recovery-specific over-proliferation (Fig.5c-d), whereas no significant changes occurred during homeostasis or injury. Further, knocking down Inx2 while opto-activating spECs prevented rapid decrease in ISC proliferation during recovery (Ext. Data Fig.8i). Also, knocking down Inx2 or Inx7 in ECs during recovery caused significantly reduced and irregular Ca2+ distribution together with significantly decreased pdm1+ levels (Fig.5e).
Gap junctions are activated by membrane potential changes, including increases in intracellular Ca2+6. This suggests that nAChR-induced Ca2+ during recovery could prompt gap junction activation in ECs. To test this, we overexpressed nAChRβ3 for two days while knocking down Inx2 in ECs during recovery (Fig.5f, Ext. Data Fig.8j). Knocking down Inx2 was sufficient to attenuate rapid decrease in ISC proliferation and block fast increase of pdm1+ ECs, thereby blocking the expedited recovery triggered by nAChRβ3 overexpression (Fig.5f, Ext. Data Fig.8j). Finally, we tested whether Inx2/Inx7 gap junctions facilitate Ca2+ responses in ECs during the nicotinic sensitivity assay. Conditionally reducing Inx2 expression resulted in significantly dampened nicotine-triggered Ca2+ increase during recovery (Fig.5g, Ext. Data Fig.8k and Videos S9-S10). We observed that Ca2+ distribution among ECs was not only reduced but also uneven (Fig.5g, Ext. Data Fig.8k and Videos S9-S10). This suggests that during recovery gap junctions facilitate nAChR-induced Ca2+ to spread evenly among ECs. Altogether, our data support that Inx2/Inx7 gap junctions are required for nAChR-mediated Ca2+ to spread in ECs during recovery and that disruption of this bioelectric signaling prevents transition to homeostasis.
Discussion
We address a fundamental question, how does transition to homeostasis occur after injury? We found that the cholinergic pathway directs the gut to return to homeostasis by coordinating neuro-epithelial interactions and bioelectric signaling (Ext. Data Fig.9). Our findings reveal that nAChR-mediated high Ca2+ in ECs is essential for recovery (Fig.3, Ext. Data Fig.5). It is reported that Ca2+ increase after nAChR activation is augmented autonomously by opening of voltage gated Ca2+ channels and release of Ca2+ from intracellular stores49. This could occur in nAChR-activated ECs during recovery likely to assist in sufficiently elevating Ca2+. We discovered that elevated Ca2+ from few ECs spreads via gap junctions to more ECs (Fig.5, Ext. Data Fig.8), which is consistent with a recent report of Ca2+ waves in R3 of the midgut50. The use of endogenous ion currents that electrically couple multiple cells so that they behave as one unit, has been linked to growth and tissue-patterning during development and regeneration9,47. Our study supports that bioelectric mechanisms regulate midgut regeneration to ensure that important physiological functions like ion transport are evenly restored across the epithelium.
Despite the increasing knowledge of protective anti-inflammatory roles for peripheral neurons, many aspects remain unclear11. We discovered that cholinergic signaling from ARCENs is required for the transition of the intestinal epithelium from injury to homeostasis (Fig.4, Ext. Data Fig.7). During recovery ARCEN-innervations undergo Egr-dependent synaptic strengthening (Fig.4h) and ECs change the levels of cholinergic components (Fig.1d, 2d-e). This coordinated plasticity, in neuro-epithelial cholinergic interactions likely occurs to control the initiation, strength, and duration of nAChR-mediated Ca2+ currents across the epithelium and precisely promote recovery. In addition, the cholinergic anti-inflammatory reflex has been proposed to be a cholinergic neuro-immune response that senses and counteracts inflammatory signals11,37. We propose that a similar mechanism exists in Drosophila and is regulated by ARCENs which reside in the posterior VNC, potentially the fly equivalent of vagus nerve. ARCENs sense Egr likely through their projections (Ext. Data Fig.6k, Ext. Data Fig.7k) and counteract gut inflammation and proliferation via neuro-EC cholinergic signaling (Fig.4, Ext. Data Fig.7). Altogether, our study broadens our current understanding of how regeneration ends by revealing how cooperation between peripheral neurons and epithelial bioelectric signaling directs a tissue towards homeostasis. This work may help identify the etiology of chronic intestinal diseases and provides a link between neurological disorders and intestinal pathologies.
Methods
Flies were crossed and raised between 19-23°C in standard fly food. All adult flies were tested 3-5 days after hatching. All experiments were done in female flies. Detailed description of experimental methods is found on Supplementary Information (SI).
Extended Data
Ext. Data Fig.1 ∣. Ace is downregulated during recovery.
a, Expression levels of conserved inflammatory cytokines (unpaired-3/upd-3 and eiger/egr) in guts of Ore R flies undergoing DSS-induced repair. Normalized to Homeostasis. n=3 biologically independent samples per condition. Tukey’s one-way Anova: p=0.0046 (upd3: Hom. vs Injury & Injury vs Rec. d4), p=0.0061(upd3: Injury vs Rec. d2), p=0.0096 (egr: Hom. vs Injury), p=0.006 (Injury vs Rec. d4). b, Expression levels of markers for PCs (escargot, esg), ECs (pdm1), EEs (prospero, pros) in guts of Ore R flies undergoing DSS-induced repair. Normalized to Homeostasis. Homeostasis: n=3 (esg), n=6 (pdm1), n=5 (pros) biologically independent samples. Injury: n=3 (esg), n=6 (pdm1), n=6 (pros) biologically independent samples. Rec. d2: n=3 (esg), n=7 (pdm1, pros) biologically independent samples. Rec. d4: n=3 (esg), n=4 (pdm1, pros) biologically independent samples. Tukey’s one-way Anova: p=0.0393 (Hom. vs Injury, esg), p=0.0112 (Injury vs Rec. d4, esg). Dunn’s Kruskal-Wallis test: p=0.0384 (Hom. vs Injury, pdm1), p=0.0227 (Injury vs Rec. 4, pdm1), p=0.0157 (Injury vs Rec. d2, pros). c, Annotated gut cell type clusters of Ore R flies after snRNAseq, visualized with UMAP (n= total of 8073 nuclei). d, Graph depicting the number of gut nuclei recovered per cluster and per condition after snRNAseq of Ore R flies (n=total of 7411 nuclei in gut clusters). e, Dot plot per snRNAseq gut cluster illustrating the average expression (blue color range) and percent of expression (dot size) of marker genes for ECs (pdm1, myo1A, mex1), EEs (pros, piezo, AstA) and for PCs (esg, Notch, Sox21a) [PCs: ISC/EB and proEC]. (n=total of 7411 gut nuclei). f, Heatmap of significantly upregulated and downregulated genes in EC clusters (S. Table 1-2) after snRNAseq (n= total of 4547 nuclei in EC clusters). Red arrow: Acetylcholinesterase (Ace). *: 0.05>p>0.01, **: 0.01>p>0.001. Data are presented as mean values ± SEM.
Ext. Data Fig.2 ∣. ACh sensitivity is required for recovery.
a, Violin plot illustrating the mean expression of Ace per condition in EC clusters after snRNAseq of Ore R flies (p=0.0364). n= 4547 nuclei in EC clusters. Statistics: two-tailed negative binomial exact test, adjusted with Benjamini-Hochberg procedure. Violin plot: median, 1st and 3rd quartile. b, Graph depicting percentage of nuclei expressing Ace per snRNAseq gut cluster and condition (n=7411 gut nuclei). c, Expression levels of Ace in Ore R guts after 18hrs of Ecc15 bacterial infection (yellow) or 2 days after Bleomycin-injury (pink) compared to unchallenged guts (5% sucrose: grey, homeostasis: light grey). n=3 biologically independent samples per condition. two-tailed t-test: p=0.0179 (Suc. vs Ecc15), p=0.0121 (Hom. vs Bleo). d, Validation of ACE overexpression using CRISPR-OE .n=3 biologically independent samples per genotype. two-tailed t-test: p=0.0461. e, Mitotic division counts of proliferating ISCs with anti-pH3 from midgut of control (mexTS > dCas9VPR) and flies with conditional Ace overexpression (mexTS > dCas9VPR, gRNA-Ace) in ECs during Recovery 2x (like Fig.1f). n=11 guts per genotype examined over 2 independent experiments. two tailed Mann-Whitney test: p=0.0001. f, pH3+ counts from midgut of control (howTS > dCas9VPR, hmlTS > dCas9VPR) and flies with conditional Ace overexpression in the visceral muscle (howTS > dCas9VPR, gRNA-Ace) and in hemocytes (immune cells, hmlTS > dCas9VPR, gRNA-Ace). Conditions like Fig. 1e. Two-way Anova. howTS>dCas9VPR: n=15(Hom, Rec.d4), n=12(Injury) guts; howTS>dCas9VPR,gRNA-Ace: n=15(Hom, Rec.d4), n=13 (Injury) guts; hmlTS > dCas9VPR: n=13(Hom.), n=12(Injury), n=10(Rec. d4) guts, hmlTS>dCas9VPR,gRNA-Ace: n=14(Hom.), n=12 (Injury), n=11(Rec. d4) guts, examined over 3 independent experiments. g, pH3+counts from midgut of control (myo1ATS> dCas9VPR, mexTS > dCas9VPR) and flies with conditional Ace overexpression (myo1ATS> dCas9VPR, gRNA-Ace and mexTS > dCas9VPR, gRNA-Ace ) in ECs after 18hrs of 5% sucrose feeding or 18hrs of Ecc15 oral infection (29°C). myo1ATS> dCas9VPR: n=10(Suc.), n=23 (Ecc15) guts; myo1ATS>dCas9VPR,gRNA-Ace: n=11(Suc.), n=24(Ecc15) guts; mexTS> dCas9VPR: n=16(Suc.), n=17(Ecc15) guts; mexTS>dCas9VPR, gRNA-Ace: n=15(Suc.), n=16 (Ecc15) guts, examined over 2 independent experiments. Tukey’s one-way Anova. h, pH3+ counts from mexTS > dCas9VPR and mexTS > dCas9VPR, gRNA-Ace guts during Homeostasis, 2 days feeding with Bleomycin (Bleo d2) and 2 days recovery after Bleomycin (Rec-Bleo d2) at 29°C. mexTS> dCas9VPR: n=15(Hom.), n=17(Bleo.), n=32 (Rec.) guts; mexTS>dCas9VPR, gRNA-Ace: n=16(Hom.), n=17 (Bleo.), n=29 (Rec.) guts, examined over 3 independent experiments. Tukey’s one-way Anova. i, Relative fluorescence intensity (ΔF/F0) per frame (5 seconds per frame) and per genotype of individual guts as described in Fig. 1g. *: 0.05>p>0.01, ***: p<0.001. Data are presented as mean values ± SEM.
Ext. Data Fig.3 ∣. nAChRβ3 is required in ECs for recovery.
a, nAcRβ3RNAi validation. n=6 (control), n=3 (nAChRβ3RNAi , nAChRβ3RNAi-2 ) biologically independent samples. Statistics: Dunnett’s one-way Anova. b, pH3+ counts from control (myo1ATS>+) guts and when nAChRβ3 is reduced in ECs (myo1ATS>nAChRβ3RNAi-2). Recovery d7: 7 days standard food (29°C) after 4 days DSS-feeding (23°C). Homeostasis d7: 7 days standard food (29°C). p= 0.0496 (Dunn’s Kruskal-Wallis test). myo1ATS>+: n=23(Hom.), n=20(Rec. d7) guts; myo1ATS>nAChRβ3RNAi-2: n=23(Hom.), n=17(Rec. d7) guts, examined over 3 independent experiments. c, pH3+ counts from mexTS>+ and mexTS>nAChRβ3RNAi guts. Recovery d14: 14 days standard food (29°C) after 4 days of DSS-feeding (23°C). Homeostasis d14: 14 days standard food (29°C). p= 0.0007(Kruskal-Wallis test). mexTS>+ : n=16(Hom.), n=20(Rec. d14) guts; mexTS>nAChRβ3RNAi: n=16(Hom.), n=19(Rec. d14) examined over 3 independent experiments. d, pH3+ counts from myo1ATS>+ and myo1ATS >nAChRβ3RNAi guts after Ecc15 oral infection and after 5% sucrose feeding. Conditions like Ext. Data Fig.2g. p= 0.0099 (Dunn’s Kruskal-Wallis test). myo1ATS>+ : n=17 (Suc.), n=19 (Ecc15) guts; myo1ATS >nAChRβ3RNAi n=15 (Suc.), n=26 (Ecc15) guts examined over 3 independent experiments. e, Representative color-coded sequential frames before (fr20) and after (fr200) ACh administration from control (mexTS > GCAM7c) and mexTS > GCAM7c +nAChRβ3RNAi midguts (Like in Fig. 1g). scale bar: 25μm. Accompanying graph: average relative fluorescence intensity (ΔF/F0) per frame (5 seconds per frame) and per genotype. n=4 (control), n=5 (nAChRβ3RNAi ) guts examined over 2 independent experiments (two-way Anova). Individual ΔF/F0 per gut on Ext. Data Fig.3j. f, pH3+ counts from control and when reducing nAcRβ3 in PCs (esgTS>nAChRβ3RNAi), EBs (su(H)GBETS>nAChRβ3RNAi), EEs (prosTS> nAChRβ3RNAi), visceral muscle (howTS > nAChRβ3RNAi) and hemocytes (hmlTS> nAChRβ3RNAi). Conditions like Fig. 1e. Statistics: Sidak’s two-way Anova. esgTS>+ : n=16 (Hom., Injury) n=17 (Rec.) guts; esgTS>nAChRβ3RNAi: n=14(Hom.), n= 20(Injury), n=18(Rec) guts, over 2 independent experiments. Su(H)GBETS>+ : n=16(Hom.), n=15 (Injury), n=13 (Rec.) guts; Su(H)GBETS>nAChRβ3RNAi: n=11(Hom., Injury), n=15(Rec) guts examined over 2 independent experiments. prosTS>+ : n=10 (Hom.), n=15(Injury), n=12(Rec.) guts; prosTS>nAChRβ3RNAi: n=10(Hom.), n=9(Injury), n=13(Rec) guts examined over 2 independent experiments. howTS>+ : n=20(Hom.), n=13(Injury), n=16(Rec.) guts; howTS>nAChRβ3RNAi: n=19(Hom.), n=13(Injury), n=16(Rec) guts examined over 2 independent experiments. hmlTS>+ : n=12(Hom.), n=13(Injury), n=14(Rec.) guts; hmlTS>nAChRβ3RNAi: n=12(Hom.), n=14(Injury), n=13(Rec) guts examined over 2 independent experiments. g, Graph depicting percentage of nuclei expressing nAChRβ3 per snRNAseq gut cluster (n=7411 gut nuclei). h, nAChRβ3-flag validation: Midgut expressing nAChRβ3-flag (mexTS> +/nAChRβ3-flag) and when knocking down nAChRβ3 in ECs (mexTS>nAChRβ3RNAi/nAChRβ3-flag). anti-Flag: nAChRβ3-flag (yellow). DAPI: nuclei (blue). Images are representative of 2 independent experiments with similar results. scale bar: 25μm. i, nAChRβ3 expression levels in Ore R guts. Tukey’s one-way Anova: p= 0.0104(Hom. vs Rec. d1), p=0.0085(Rec. d1 vs Rec. d8). n= 6 (Hom.), n=3(Rec. d1, Rec. d8) biologically independent samples. j-k, Relative fluorescence intensity (ΔF/F0) per frame (5 seconds per frame) and genotype of each gut as described in Ext. Data Fig.3e and Fig. 2g, respectively. *: 0.05>p>0.01, **: 0.01<p<0.001, ***: p<0.001. Data are presented as mean values ± SEM.
Ext. Data Fig.4 ∣. nAChRβ3 promotes EC maturation.
a, Representative image of posterior midgut from control (mexTS>+/Egr-GFP) flies and when nAChRβ3 is reduced in ECs (mexTS>nAChRβ3RNAi/ Egr-GFP) together with the protein trap Egr-GFP (anti-GFP, green). Accompanying graph: fluorescence fold change per image. n=10 (control), n=9 (nAChRβ3RNAi) guts examined over 2 independent experiments. Statistics: two-tailed Mann-Whitney test, p=0.0057. Conditions like Fig.1e. scale bar: 50μm. b, Representative images of posterior midguts from control (mexTS>+/Vn-LacZ) and when nAChRβ3 is reduced in ECs (mexTS> nAChRβ3RNAi/Vn-LacZ) together with the Vn-LacZ reporter (anti-β-gal, white). Accompanying graph: fluorescence fold change per image. n=10 (control), n=9 (nAChRβ3RNAi) guts examined over 2 independent experiments. Conditions like Fig.1e. Statistics: two-tailed t-test, p=0.0279. scale bar: 50μm. c, Representative images of posterior midguts from myo1ATS>+ and myo1ATS> nAChRβ3RNAi flies stained with anti-Dcp1: cell death (pink). Conditions like Fig.1e. Accompanying graph: Dcp1+ cells per image. n=8 (control), n=11 (nAChRβ3RNAi) guts examined over 2 independent experiments. Statistics: two-tailed Mann-Whitney test. scale bar: 50μm. d, Representative images of posterior midguts from control (myo1ATS>+/Diap1-LacZ) and when knocking down nAChRβ3 in ECs (myo1ATS> nAChRβ3RNAi/Diap1-LacZ) together with Diap1-LacZ (Yki target gene, anti-β-gal: white). Conditions like Fig.1e. Accompanying graph: fluorescence fold change per image. n=7 (control), n=8 (nAChRβ3RNAi) guts examined over 2 independent experiments. Statistics: two-tailed t-test. scale bar: 50μm. e, Representative images of posterior midgut from control (myo1ATS>+/Ex-LacZ) and when nAChRβ3 is reduced in ECs (myo1ATS> nAChRβ3RNAi /Ex-LacZ) together with Ex-LacZ (Yki target gene, anti-β-gal: white). Conditions like Fig.1e. Boxplot: fluorescence fold change per image (median, 1st and 3rd quartile, whiskers: minimum maximum values). n=11 guts per genotype examined over 2 independent experiments. Statistics: two-tailed Mann-Whitney test, p=0.0014. scale bar: 50μm. f-g, Representative images from posterior midgut of mexTS>+ and mexTS> nAChRβ3RNAi flies stained with anti-pdm1: EC (yellow). Conditions like Fig.1e. Boxplot: pdm1+ cells over total nuclei per image (median, 1st and 3rd quartile, whiskers: minimum maximum values). n=15 (control), n=18 (nAChRβ3RNAi) guts examined over 3 independent experiments. Statistics: two-tailed t-test. scale bars: 50μm(f),100μm(g). h, Pros expression levels. n=3 biologically independent samples per genotype. Statistics: two-tailed t-test. i, Representative images of posterior midgut assayed with MQAE dye (intracellular Cl− via diffusion-limited collisional quenching, yellow) and SodiumGreen dye (intracellular Na+, green) from control myo1ATS>+ and myo1ATS>nAChRβ3RNAi flies. PI: nuclei (Propidium Iodide, red). See Methods for conditions. Accompanying graphs: fluorescence fold change per image. n= 9 (control/MQAE), n=7 (nAChRβ3RNAi/MQAE) guts, n=7 (SodiumGreen per genotype) guts examined over 2 independent experiments per dye. Statistics: p=0.0115 (two tailed Mann-Whitney test/ MQAE), p=0.0103 (two-tailed t-test/SodiumGreen). scale bar: 20μm. j, Representative images from posterior midgut with PCs expressing NFAT-CaLexA (esgTS>NFAT-CaLexA). anti-GFP: Ca2+ (green). NFAT-CaLexA was expressed for 2 days (29°C) per condition. Accompanying graph: fluorescence fold change per image. n= 8 (Hom., Injury), n=10 (Rec. d2) guts examined over 2 independent experiments (Tukey’s one-way Anova). scale bar: 50μm. *: 0.05>p>0.01, **: 0.01<p<0.001, ***: p<0.001. n.s.: non-significant. Data are presented as mean values ± SEM.
Ext. Data Fig.5 ∣. nAChRβ3-mediated Ca2 promotes recovery.
a, pH3+ counts of control (mexTS>+), guts with Orai (Ca2+ channel) overexpressed in ECs (mexTS>Orai), nAChRβ3 reduced in ECs (mexTS>nAChRβ3RNAi-2) and combined (mexATS>nAChRβ3RNAi-2+ Orai) during Recovery d4 (Like Fig.1e). n=15 (mexTS>+), n=19 (mexTS>nAChRβ3RNAi-2), n=16 (mexTS>Orai), n=11(mexATS>nAChRβ3RNAi-2+ Orai) guts examined over 2 independent experiments. Statistics: Dunn’s Kruskal-Wallis test, p=0.013 (nAChRβ3RNAi-2 vs nAChRβ3RNAi-2+ Orai). b, Representative images of posterior midgut of flies as in Ext. Data Fig.5a. anti-pdm1: ECs (grey). Boxplot: pdm1+ cells over total nuclei per image (median, 1st and 3rd quartile, whiskers: minimum maximum values). n=10 (control), n=9 (nAChRβ3RNAi-2, Orai nAChRβ3RNAi-2+ Orai guts) guts examined over 2 independent experiments. Statistics: Tukey’s one-way Anova, p=0.0048 (nAChRβ3RNAi-2 vs Orai), p=0.0144 (nAChRβ3RNAi-2 vs nAChRβ3RNAi-2+ Orai). scale bar: 25μm. c, Representative images of posterior midguts assayed with MQAE (like Ext. Data Fig.4i) of myo1ATS>+, myo1ATS>Orai, myo1ATS>nAChRβ3RNAi-2 and myo1ATS>nAChRβ3RNAi-2 + Orai flies. Accompanying graph: fluorescence fold change per image. n=6 (myo1ATS>+), n=6 (myo1ATS>nAChRβ3RNAi-2), n=7(myo1ATS>Orai), n=7 (myo1ATS>nAChRβ3RNAi-2 +Orai) guts examined over 2 independent experiments. Statistics: Tukey’s one-way Anova, p=0.0002 (control vs nAChRβ3RNAi-2), p=0.0084 (Orai vs nAChRβ3RNAi-2), p=0.0441 (nAChRβ3RNAi-2 vs Orai + nAChRβ3RNAi-2). scale bar: 25μm. d, pH3+ counts from control (mexTS>+) and flies overexpressing parvalbumin in ECs (mexTS>PV). Conditions like Fig. 1e. Control: n=14 (Hom.), n=37 (Rec.d4) guts, mexTS>PV: n=17 (Hom.), n=30 (Rec.d4) guts examined over 3 independent experiments. Statistics: Dunn’s Kruskal-Wallis test. e, Validation of UAS-nAcRβ3. n=6 (control), n=3 (myo1ATS> nAcRβ3) biologically independent samples. Statistics: two-tailed Mann-Whitney test, p=0.0357. f, Validation of a’: mexLexA (mexLexA::GAD), scale bar: 200μm. Image is representative of 2 independent experiments with similar results; b’: LexAopnAChRβ3. n= 3 biologically independent samples per genotype. Statistics: two-tailed t-test, p=0.0012. g, a’: Representative color-coded sequential frames of mexTS>GCAM7c and mexTS>GCAM7c+nAChRβ3 guts before (t15) and after (t150) nicotine administration. b’: average relative fluorescence intensity (ΔF/F0) per frame (5 seconds per frame) and genotype. Conditions: 2 days standard food (29°C). N=6 guts per genotype examined over 2 independent experiments. c’: relative fluorescence intensity of each gut. Statistics: two-way Anova. scale bar: 25μm. h, Representative images of posterior midguts from control (mexLexATS>+/upd3>GFP) and when nAChRβ3 is overexpressed in ECs (mexLexATS> LexAopnAChRβ3 /upd3>GFP) together with upd3-Gal4 driving UAS-GFP (anti-GFP, white). Conditions like Fig. 3g. Accompanying graph: fluorescence fold change per image. n=8 (control), n=9 (mexLexATS> LexAopnAChRβ3) guts examined over 2 independent experiments. Statistics: two-tailed Mann-Whitney test, p=0.0002. scale bar: 100μm. i, Representative images of posterior midguts from mexLexATS>+/Egr-GFP and mexLexATS>LexAopnAChRβ3/Egr-GFP flies (anti-GFP, green). Conditions like Fig. 3g. Accompanying graph: fluorescence fold change per image. n=9 guts per genotype examined over 2 independent experiments. Statistics: two-tailed t-test, p=0.0006. scale bar: 25μm. j, Representative images of posterior midguts from control (mexTS>+) and mexTS>nAChRβ3 flies stained with anti-Dcp1(pink). Conditions like Fig. 3g. Accompanying graph: Dcp1+ cells per image. n=9 (control), n=13 (mexTS>nAChRβ3) guts per genotype examined over 2 independent experiments. Statistics: two-tailed Mann-Whitney test, p=0.0064. scale bar: 100μm. DAPI: nuclei (blue). PI: nuclei (Propidium iodide, red). *: 0.05>p>0.01, **: 0.01<p<0.001, ***: p<0.001. Data are presented as mean values ± SEM.
Ext. Data Fig.6 ∣. R49E06-neurons innervate the gut.
a, pH3+ counts from control and from flies with conditional reduction of ChAT (Choline Acetyltransferase) in EEs (prosTS>), PCs (esgTS>), ECs (myo1ATS>), hemocytes (hmlTS>), visceral muscle (howTS> ). Conditions like Fig.1e. prosTS>+: n=20 (Hom.), n=9 (Injury), n=18 (Rec.) guts, prosTS>ChATRNAi: n=20 (Hom.), n=9 (Injury), n=16 (Rec.) guts; esgTS>+: n=13 (per condition) guts, esgTS>ChATRNAi: n=15 (Hom.), n=12 (Injury), n=15 (Rec.) guts; myo1ATS>+: n=11(Hom.), n=10 (Injury), n=12 (Rec.) guts, myo1ATS>ChATRNAi: n=12 (Hom.), n=10 (Injury), n=11 (Rec.) guts; hmlTS>+: n=13 (Hom.), n=11 (Injury), n=10 (Rec.) guts, hmlTS>ChATRNAi: n=12 (Hom.), n=11 (Injury), n=11 (Rec.) guts; howTS>+: n=11(Hom.), n=10 (Injury), n=15 (Rec.) guts, howTS>ChATRNAi: n=12 (Hom.), n=11 (Injury), n=15 (Rec.) guts examined over two independent experiments per cell type. Statistics: Sidak’s two-way Anova. b, pH3+counts from control (esg>+) and from flies without EEs (esg>scRNAi). n= 12 (control), n= 10 (esg>scRNAi) guts examined over 2 independent experiments. Statistics: two-tailed t-test. c, VNC (adult Ventral Nerve Cord), brain, and gut from R49E06>mCD8GFP and R49E06>2xEGFP flies. Images are representative of 3 independent experiments with similar results. anti-GFP: green. scale bar: 100μm. d, Posterior VNC from R49E06>mCD8GFP flies and together with the cholinergic repressor R49E06>mCD8GFP/ChAT-Gal80. anti-GFP: green. scale bar: 100μm. Images are representative of 2 independent experiments with similar results. e-f, Z-stack (e) and single Z-planes (f) from posterior VNC of R49E06>6xmCherry. anti-DsRed: magenta, anti-ChAT: yellow, numbered squares: ChAT+R49E06-neurons. scale bar: 50μm(e), 10μm (f). Image (e) is representative of 2 independent experiments with similar results. g, Posterior VNC from R49E06>6xmCherry. anti-pros: magenta, anti-DsRed: cyan. Ventral and dorsal from same stack. scale bar: 100μm. Images are representative of 2 independent experiments with similar results. h, R49E06-innervations (anti-GFP, green) in midguts of R49E06>mCD8GFP flies; a’: R4, Homeostasis, b’: R5, Recovery d2. Red square: domain of R49E06-innervation in c. c’: R49E06-innervation (grey line), anti-ChAT: yellow. scale bar: 20μm(h-a'), 10μm (h-b’), 2μm (h-c’). Images are representative of 2 independent experiments with similar results per condition. i, a’: innervated R4, b’: R5 from R49E06>mCD8GFP flies during Homeostasis. anti-GFP: R49E06-innervations (green), anti-Syt1: synaptic-vesicle marker (magenta). Yellow dots: Syt1+ boutons across innervations. scale bar: 4μm. Images are representative of 2 independent experiments with similar results. j, R49E06TS>syt1HA fly abdomen during Recovery d2. Yellow arrows: R49E06-innervations (anti-HA, magenta). scale bar: 50μm. Images are representative of 3 independent experiments with similar results. k, Fly abdomen with DenMarK expressed in R49E06-projections (R49E06TS>DenMark) during Recovery d2 (like Fig. 4a). anti-DsRed: DenMark (yellow). White arrow: DenMark-expressing ARCEN-projections, Dotted red line: gut. scale bar: 100μm. Images are representative of 2 independent experiments with similar results. l, R5 from R49E06TS>syt1HA+mexLexA>6xLexAopGFP (a’) and R49E06TS>syt1HA+mexLexA>LexAopGFP (b’) flies during Recovery d2. Yellow arrowheads: R49E06-innervations carrying the presynaptic marker syt1HA (anti-HA, magenta) near ECs (anti-GFP, green). Images are representative of 3 independent experiments with similar results. scale bar: 10μm. Phalloidin: muscle (blue). DAPI: nuclei (blue or white); n.s.: non-significant. Data are presented as mean values ± SEM.
Ext. Data Fig.7 ∣. Egr-ARCENs signaling promotes recovery.
a-b, Pros, upd3, vn, egr expression levels from control (R49E06TS>+) guts and guts after knocking down ChAT in R49E06-neurons (R49E06TS>ChATRNAi). Conditions like Fig. 1e. a: n=3 biologically independent samples. b: n=4 biologically independent samples. Normalized to R49E06TS>+. Statistics: (a) two-tailed t-test, (b) Sidak’s two-way Anova: p=0.0038 (upd3), p=0.0412 (vn), p=0.0298(egr). c, pH3+ counts from R49E06TS>+ (control), R49E06TS>ChATRNAi flies and flies co-expressing the VNC repressor (R49E06TS>ChATRNAi/Tsh-Gal80). n= 21 (control), n=24 (R49E06TS>ChATRNAi, R49E06TS>ChATRNAi/Tsh-Gal80) guts examined over 3 independent experiments. Statistics: Dunn’s Kruskal-Wallis test: p=0.0004. Conditions like Fig. 1e. d, pH3+ counts from R49E06TS>+ and R49E06TS>ChATRNAi flies after oral Ecc15 infection or 5% sucrose feeding (like Ext. Data Fig.2g). n=27 (R49E06TS>+ per condition), n=24 (R49E06TS>ChATRNAi, sucrose), n=32 (R49E06TS>ChATRNAi, Ecc15) guts examined over 3 independent experiments. Statistics: Dunn’s Kruskal-Wallis test: p=0.013. e, Experimental schematic and pH3+ counts, from control (ARCENs>+) files, flies with 6hrs thermo-activation of ARCENs with theTrpA1 channel (ARCENs>TrpA1) and when cholinergic neurons are inhibited (ARCENs>TrpA1/ChAT-Gal80). n=28 (control), n=29 (ARCENs>TrpA1), n=12 (ARCENs>TrpA1/ChAT-Gal80) guts examined over 2 independent experiments. Dunn’s Kruskal-Wallis test: p= 0.0005(control vs TrpA1), p= 0.0069 (TrpA1 vs TrpA1/ChAT-Gal80). f, upd3, vn, egr expression levels from ARCENs>+ (control) and ARCENs>TrpA1 guts. Conditions like Ext. Data Fig.7e. n=3 biologically independent samples per genotype. Normalized to ARCENs>+. Sidak’s two-way Anova: p=0.0114 (upd3), p=0.0109 (vn), p=0.0461(egr). g, Validation of R49E06QF. a’: gut (scale bar: 200μm), b’: posterior VNC (scale bar 50μm). Images are representative of 2 independent experiments with similar results. h, pH3+ counts from control (ARCENsTS>+) flies, flies with TNF receptor wgn reduced in ARECNs (ARCENsTS>wgnRNAi-2) and flies co-expressing the VNC repressor (ARCENsTS>wgnRNAi-2/Tsh-Gal80). Conditions like Fig.1e. n=21 (control), n=22 (ARCENsTS>wgnRNAi-2), n=25(ARCENsTS>wgnRNAi-2/Tsh-Gal80) guts examined over 3 independent experiments. Dunn’s Kruskal-Wallis: p=0.0004(control vs wgnRNAi-2), p=0.0105(wgnRNAi-2 vs wgnRNAi-2 /Tsh-Gal80). i, pH3+ from control (LucRNAi) and flies with egr reduced (egrRNAi) in PCs (esgTS>), ECs (mexTS>) and hemocytes (hmlTS>). Conditions like Fig.1e. esgTS: n=13 (control), n=14 (egrRNAi) guts examined over 2 independent experiments (two-tailed Mann-Whitney test). mexTS: n=12 (control), n=13 (egrRNAi) guts examined over 2 independent experiments (two-tailed Mann-Whitney test). hmlTS: n=14 (control), n=13 (egrRNAi) guts examined over 2 independent experiments (two-tailed Mann-Whitney test, p=0.028). esg+mexTS: n=14 guts per genotype examined over 2 independent experiments (two-tailed Mann-Whitney test). mex+hmlTS: n=16 (control), n=13 (egrRNAi) guts examined over 2 independent experiments (two-tailed t-test). esg+hmlTS: n=21 (control), n=19 (egrRNAi) guts examined over 3 independent experiments (two-tailed Mann-Whitney test). esg+mex+hmlTS: n=16 (control), n=19 (egrRNAi) guts examined over 3 independent experiments (two-tailed Mann-Whitney test). j, pH3+ counts from esg+hml+mexTS>LucRNAi (control) and esg+hml+mexTS>egrRNAi flies. Conditions like Fig.1e. control: n=23 (Hom.), n=22 (Injury), n=40 (Rec.) guts; egrRNAi: n=24 (Hom.), n=22 (Injury), n=39 (Rec.) guts examined over 3 independent experiments. Statistics: Sidak’s two-way Anova. k, a’: Schematic of Egr-GFP bound to extracellular morphotrap (VHHaGFP). b’-d’: Images from the abdomen (b’,d’) and thorax (c’) of flies expressing the morhotrap in ARCENs while expressing Egr-GFP (ARCENsTS>morphotrap/Egr-GFP) and of control flies without the morphotrap (ARCENsTS>Cherry/Egr-GFP). white dotted lines: ARCEN projections. red lines: midgut (b’,d’: posterior, c’: anterior). Sectioning like Fig.4a. anti-DsRed: Morphotrap and Cherry (magenta). Anti-GFP: Egr (green), Phalloidin: muscle (blue), DAPI: nuclei (blue). Images are representative of 2 independent experiments with similar results. scale bar 50μm. n.s.: non-significant ,*: 0.05>p>0.01, **: 0.01<p<0.001, ***: p<0.001. Data are presented as mean values ± SEM.
Ext. Data Fig.8 ∣. Ca2+ spreads in ECs via gap junctions.
a, Gut image with a subpopulation of ECs (spECs) expressing GFP (spECs > 6xGFP) that are located in R4c (between R4 and R5). anti-GFP: green. Red dotted square: area imaged in Ext. Data Fig.8b. scale bar 100μm. Image is representative of 2 independent experiments with similar results. b, a’: Posterior midgut images of flies expressing CsChrimson in spECs (spEC>CsChrimson, yellow) while expressing GCAMP7c in all ECs (mexLexA >LexAopGCAMP7c, grey). b’: Color-coded sequential frames from spEC>CsChrimson+mexLexA > LexAopGCaMP7c gut prior (t30) and during (t60) CsChrimson-activation. Lower panels: Heptanol addition (gap junction blocker). c’: Fluorescence intensity (ΔF/F0) of neighboring ECs (non-expressing CsChrimson) per frame (~3 sec/frame) per condition. Upper graph: average ΔF/F0 per condition. Lower graph: individual ΔF/F0 per gut. n=10 (Neighboring ECs), n=9 (Neighboring ECs+Heptanol) guts examined over 3 independent experiments. Statistics: two-way Anova. yellow dots: CsChrimson-expressing ECs (spECs). scale bar 20μm. c, Mean expression of each Innexin (gap junction components) in all snRNAseq EC clusters per condition (n= 4547 nuclei in EC clusters). Boxplot: median, 1st and 3rd quartile, whiskers: minimum maximum values. d, Graph depicting Inx2 and Inx7 mean expression per snRNAseq gut cluster and condition (n=7411 gut nuclei). e, Graph depicting the percentage of nuclei expressing Inx7 and Inx2 per snRNAseq gut cluster and condition (n=7411 gut nuclei). f, Posterior midgut expressing GFP in ECs (mex>2xGFP). anti-GFP: green, anti-Inx2: magenta. scale bar 20μm. Image is representative of 2 independent experiments with similar results. g, Posterior midgut of control (mexTS>+), and when conditionally knocking down Inx2 and Inx7 in ECs (mexTS>Inx2RNAi and mexTS>Inx7RNAi). Conditions: 2 days standard food (29°C). anti-Inx2: grey. Images are representative of 2 independent experiments with similar results. scale bar 20μm. h, Validation of Inx7 RNAi. n=3 biologically independent samples per genotype. Statistics: two-tailed t-test (p=0.0188). i, pH3+ counts from spECs>CsChrimson and spECs>CsChrimson+ Inx2RNAi flies without or with 7hr opto-activation (red square) during Recovery d1. No light: n=17(spECs>CsChrimson), n=18 (spECs>CsChrimson+ Inx2RNAi) guts; Red light: n=18(spECs>CsChrimson), n=22 (spECs>CsChrimson+ Inx2RNAi) guts, examined over 3 independent experiments (Tukey’s two-way Anova). j, Posterior midgut images from mexTS>+, mexTS>nAcRβ3, mexTS>Inx2RNAi and mexTS> nAcRβ3+Inx2RNAi flies. scale bar 20μm. Conditions like Fig.5f. anti-pdm1: ECs (grey). Accompanying boxplot: pdm1+ ratio (median, 1st and 3rd quartile, whiskers: minimum maximum values). n=7 (mexTS>nAcRβ3), n=6 ( mexTS>+, mexTS>Inx2RNAi, mexTS> nAcRβ3+Inx2RNAi ) guts, examined over 2 independent experiments. Tukey’s two-way Anova: p=0.0392 (mexTS>+ vs mexTS>nAcRβ3), p=0.0307 (mexTS>+ vs mexTS>Inx2RNAi), p=0.0003 (mexTS>nAcRβ3 vs mexTS> nAcRβ3+Inx2RNAi). k, Relative fluorescence intensity (ΔF/F0) per frame (3 seconds per frame) per genotype and per condition of individual guts as described in Fig.5g. n= 6(Hom.), n=9(Rec.),n=8(Inx2RNAi) guts examined over 2 independent experiments. DAPI: blue (nuclei). *: 0.05>p>0.01, **: 0.01<p<0.001, ***: p<0.001. Data are presented as mean values ± SEM.
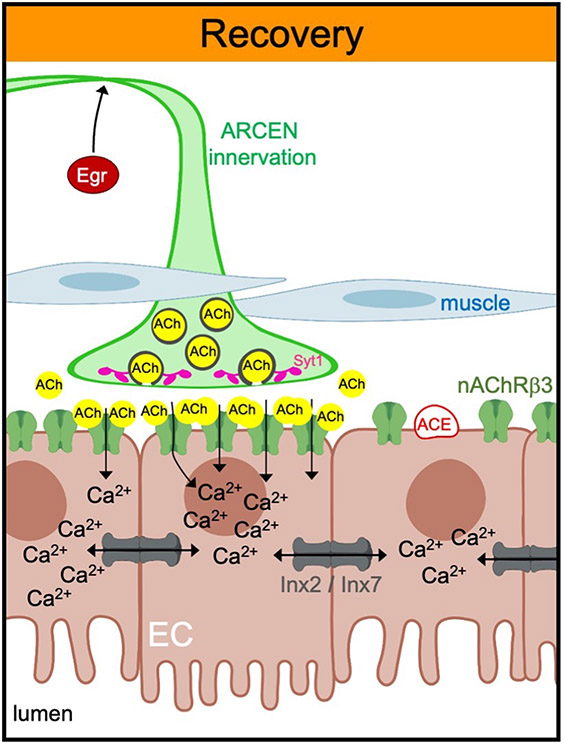
Ext. Data Fig.9 ∣. ARCENs trigger nAchRβ3-mediated Ca2+ currents in ECs to promote intestinal epithelial recovery after injury.
Model: During recovery, ECs become sensitive (Ace reduction) and receptive (nAChRβ3 increase) to ACh while ARCEN-innervations strengthen their Syt1+ boutons in an Egr-dependent manner. Cholinergic signaling from ARCENs to ECs triggers nAChR-mediated Ca2+ currents that propagate across more ECs via Inx2/Inx7 gap junctions to advance EC maturation, ion balance and transition to homeostasis. Illustration generated with BioRender.com
Supplementary Material
Acknowledgments:
We thank Stephanie Mohr and Justin Blau for comments on the manuscript. Confocal imaging was conducted at MicRoN Facility at Harvard Medical School, and we thank Paula Montero Llopis for advice. We thank the Cepko lab at Harvard Medical School for sharing their vibratome. We also thank Mike Levin for discussions and Hugo Bellen, Guy Tanentzapf, Kate O'Connor-Giles, Xiaohang Yang, Chris Potter, Todd R. Laverty, Gerry Rubin, Janelia FlyLight, DSHB, DRSC/TRiP, VDRC and the Bloomington Stock Center for fly lines, antibodies, and reagents. We thank Frederik Wirtz-Peitz, Sudhir Gopal Tattikota, Rich Binari and Haofan Li for help in this project and Patrick Jouandin, Pedro Saavedra, Liz Lane, David Doupé, Justin Bosch, Ben Ewen-Campen, Lucy Liu, Charles Xu, Misty Rose Riddle, Tyler Huycke for advice and reagents. We thank Christians Villalta and Bestgene for fly injections, Hunter Elliot and Marcelo Cicconet at the Image and Data Analysis Facility (IDAC) and Simon Norrelykke at the Image Analysis Collaboratory (IAC) at Harvard Medical School for advice on Imaris, Shahar Alon for advice on expansion microscopy, and the Biopolymers Facility and Computing facilities and PCMM Flow Cytometry Facility at Harvard Medical School. All illustrations were created with BioRender.com.
Funding:
During this study AP was a Good Ventures fellow of the Life Science Research Foundation and next was supported by the Center for the Study of Inflammatory Bowel Disease (DK043351). NP is an investigator of the Howard Hughes Medical Institute. YH, YL and AC were supported by P41GM132087 and BBSRC-NSF/BIO (DBI-2035515). YL was supported by the Finnish Cultural Foundation.
Footnotes
All authors declare that they have no competing interests.
Supplementary Information and Source Data Files are available for this paper.
Data availability:
Raw data from main and Extended Data Figures are available in the Source Data files provided with this work. Reagents are available upon request. The snRNA-seq datasets generated in this work are publicly available in the Gene Expression Omnibus (GEO) databases under GSE218641 accession code.
GSE218641: [https://www.ncbi.nlm.nih.gov/geo/query/acc.cgi?acc=GSE218641], snRNA-seq dataset of gut from Ore R females flies during Homeostasis and Recovery
Single-nuclei profiling data from this study can be found at https://www.flyrnai.org/tools/rna_seq_base/web/showProject/39/plot_coord=1/sample_id=all , to allow users to query the expression of any gene of interest.
All other data are available in Figures, Ext. Data Figures and SI files (SI, SI figure, S. videos, S. Tables)
Code availability:
This study does not use any custom codes for analysis. snRNA-seq dataset were analyzed using standard Seurat pipeline.
References
- 1.Karin M & Clevers H Reparative inflammation takes charge of tissue regeneration. Nature 529, 307–315, doi: 10.1038/nature17039 (2016). [DOI] [PMC free article] [PubMed] [Google Scholar]
- 2.Miguel-Aliaga I, Jasper H & Lemaitre B Anatomy and Physiology of the Digestive Tract of Drosophila melanogaster. Genetics 210, 357–396, doi: 10.1534/genetics.118.300224 (2018). [DOI] [PMC free article] [PubMed] [Google Scholar]
- 3.Wessler I & Kirkpatrick CJ Acetylcholine beyond neurons: the non-neuronal cholinergic system in humans. Br J Pharmacol 154, 1558–1571, doi: 10.1038/bjp.2008.185 (2008). [DOI] [PMC free article] [PubMed] [Google Scholar]
- 4.Wiesner J, Kriz Z, Kuca K, Jun D & Koca J Acetylcholinesterases--the structural similarities and differences. J Enzyme Inhib Med Chem 22, 417–424, doi: 10.1080/14756360701421294 (2007). [DOI] [PubMed] [Google Scholar]
- 5.Igaki T et al. Eiger, a TNF superfamily ligand that triggers the Drosophila JNK pathway. EMBO J 21, 3009–3018, doi: 10.1093/emboj/cdf306 (2002). [DOI] [PMC free article] [PubMed] [Google Scholar]
- 6.Guiza J, Barria I, Saez JC & Vega JL Innexins: Expression, Regulation, and Functions. Front Physiol 9, 1414, doi: 10.3389/fphys.2018.01414 (2018). [DOI] [PMC free article] [PubMed] [Google Scholar]
- 7.Snigdha K, Gangwani KS, Lapalikar GV, Singh A & Kango-Singh M Hippo Signaling in Cancer: Lessons From Drosophila Models. Front Cell Dev Biol 7, 85, doi: 10.3389/fcell.2019.00085 (2019). [DOI] [PMC free article] [PubMed] [Google Scholar]
- 8.Subramanian S, Geng H & Tan XD Cell death of intestinal epithelial cells in intestinal diseases. Sheng Li Xue Bao 72, 308–324 (2020). [PMC free article] [PubMed] [Google Scholar]
- 9.Levin M Bioelectric signaling: Reprogrammable circuits underlying embryogenesis, regeneration, and cancer. Cell 184, 1971–1989, doi: 10.1016/j.cell.2021.02.034 (2021). [DOI] [PubMed] [Google Scholar]
- 10.Hirota CL & McKay DM Cholinergic regulation of epithelial ion transport in the mammalian intestine. Br J Pharmacol 149, 463–479, doi: 10.1038/sj.bjp.0706889 (2006). [DOI] [PMC free article] [PubMed] [Google Scholar]
- 11.Goverse G, Stakenborg M & Matteoli G The intestinal cholinergic anti-inflammatory pathway. J Physiol 594, 5771–5780, doi: 10.1113/JP271537 (2016). [DOI] [PMC free article] [PubMed] [Google Scholar]
- 12.Panayidou S & Apidianakis Y Regenerative inflammation: lessons from Drosophila intestinal epithelium in health and disease. Pathogens 2, 209–231, doi: 10.3390/pathogens2020209 (2013). [DOI] [PMC free article] [PubMed] [Google Scholar]
- 13.Micchelli CA & Perrimon N Evidence that stem cells reside in the adult Drosophila midgut epithelium. Nature 439, 475–479, doi: 10.1038/nature04371 (2006). [DOI] [PubMed] [Google Scholar]
- 14.Ohlstein B & Spradling A The adult Drosophila posterior midgut is maintained by pluripotent stem cells. Nature 439, 470–474, doi: 10.1038/nature04333 (2006). [DOI] [PubMed] [Google Scholar]
- 15.Jiang H, Tian A & Jiang J Intestinal stem cell response to injury: lessons from Drosophila. Cell Mol Life Sci 73, 3337–3349, doi: 10.1007/s00018-016-2235-9 (2016). [DOI] [PMC free article] [PubMed] [Google Scholar]
- 16.Guo Z, Driver I & Ohlstein B Injury-induced BMP signaling negatively regulates Drosophila midgut homeostasis. J Cell Biol 201, 945–961, doi: 10.1083/jcb.201302049 (2013). [DOI] [PMC free article] [PubMed] [Google Scholar]
- 17.Tracy Cai X et al. AWD regulates timed activation of BMP signaling in intestinal stem cells to maintain tissue homeostasis. Nat Commun 10, 2988, doi: 10.1038/s41467-019-10926-2 (2019). [DOI] [PMC free article] [PubMed] [Google Scholar]
- 18.Agaisse H, Petersen UM, Boutros M, Mathey-Prevot B & Perrimon N Signaling role of hemocytes in Drosophila JAK/STAT-dependent response to septic injury. Dev Cell 5, 441–450, doi: 10.1016/s1534-5807(03)00244-2 (2003). [DOI] [PubMed] [Google Scholar]
- 19.Buchon N et al. Morphological and molecular characterization of adult midgut compartmentalization in Drosophila. Cell Rep 3, 1725–1738, doi: 10.1016/j.celrep.2013.04.001 (2013). [DOI] [PubMed] [Google Scholar]
- 20.Tian A, Wang B & Jiang J Injury-stimulated and self-restrained BMP signaling dynamically regulates stem cell pool size during Drosophila midgut regeneration. Proc Natl Acad Sci U S A 114, E2699–E2708, doi: 10.1073/pnas.1617790114 (2017). [DOI] [PMC free article] [PubMed] [Google Scholar]
- 21.Dana H et al. High-performance calcium sensors for imaging activity in neuronal populations and microcompartments. Nat Methods 16, 649–657, doi: 10.1038/s41592-019-0435-6 (2019). [DOI] [PubMed] [Google Scholar]
- 22.Li M, Sun S, Priest J, Bi X & Fan Y Characterization of TNF-induced cell death in Drosophila reveals caspase- and JNK-dependent necrosis and its role in tumor suppression. Cell Death Dis 10, 613, doi: 10.1038/s41419-019-1862-0 (2019). [DOI] [PMC free article] [PubMed] [Google Scholar]
- 23.Karpowicz P, Perez J & Perrimon N The Hippo tumor suppressor pathway regulates intestinal stem cell regeneration. Development 137, 4135–4145, doi: 10.1242/dev.060483 (2010). [DOI] [PMC free article] [PubMed] [Google Scholar]
- 24.Ren F et al. Hippo signaling regulates Drosophila intestine stem cell proliferation through multiple pathways. Proc Natl Acad Sci U S A 107, 21064–21069, doi: 10.1073/pnas.1012759107 (2010). [DOI] [PMC free article] [PubMed] [Google Scholar]
- 25.Dolan B, Ermund A, Martinez-Abad B, Johansson MEV & Hansson GC Clearance of small intestinal crypts involves goblet cell mucus secretion by intracellular granule rupture and enterocyte ion transport. Sci Signal 15, eabl5848, doi: 10.1126/scisignal.abl5848 (2022). [DOI] [PMC free article] [PubMed] [Google Scholar]
- 26.Masuyama K, Zhang Y, Rao Y & Wang JW Mapping neural circuits with activity-dependent nuclear import of a transcription factor. J Neurogenet 26, 89–102, doi: 10.3109/01677063.2011.642910 (2012). [DOI] [PMC free article] [PubMed] [Google Scholar]
- 27.Deng H, Gerencser AA & Jasper H Signal integration by Ca(2+) regulates intestinal stem-cell activity. Nature 528, 212–217, doi: 10.1038/nature16170 (2015). [DOI] [PMC free article] [PubMed] [Google Scholar]
- 28.Xu C, Luo J, He L, Montell C & Perrimon N Oxidative stress induces stem cell proliferation via TRPA1/RyR-mediated Ca(2+) signaling in the Drosophila midgut. Elife 6, doi: 10.7554/eLife.22441 (2017). [DOI] [PMC free article] [PubMed] [Google Scholar]
- 29.Amcheslavsky A et al. Enteroendocrine cells support intestinal stem-cell-mediated homeostasis in Drosophila. Cell Rep 9, 32–39, doi: 10.1016/j.celrep.2014.08.052 (2014). [DOI] [PMC free article] [PubMed] [Google Scholar]
- 30.Kumar A & Brockes JP Nerve dependence in tissue, organ, and appendage regeneration. Trends Neurosci 35, 691–699, doi: 10.1016/j.tins.2012.08.003 (2012). [DOI] [PubMed] [Google Scholar]
- 31.Lai NY et al. Gut-Innervating Nociceptor Neurons Regulate Peyer's Patch Microfold Cells and SFB Levels to Mediate Salmonella Host Defense. Cell 180, 33–49 e22, doi: 10.1016/j.cell.2019.11.014 (2020). [DOI] [PMC free article] [PubMed] [Google Scholar]
- 32.Matheis F et al. Adrenergic Signaling in Muscularis Macrophages Limits Infection-Induced Neuronal Loss. Cell 180, 64–78 e16, doi: 10.1016/j.cell.2019.12.002 (2020). [DOI] [PMC free article] [PubMed] [Google Scholar]
- 33.Han H et al. Gut-neuron interaction via Hh signaling regulates intestinal progenitor cell differentiation in Drosophila. Cell Discov 1, 15006, doi: 10.1038/celldisc.2015.6 (2015). [DOI] [PMC free article] [PubMed] [Google Scholar]
- 34.Kenmoku H, Ishikawa H, Ote M, Kuraishi T & Kurata S A subset of neurons controls the permeability of the peritrophic matrix and midgut structure in Drosophila adults. J Exp Biol 219, 2331–2339, doi: 10.1242/jeb.122960 (2016). [DOI] [PubMed] [Google Scholar]
- 35.Jenett A et al. A GAL4-driver line resource for Drosophila neurobiology. Cell Rep 2, 991–1001, doi: 10.1016/j.celrep.2012.09.011 (2012). [DOI] [PMC free article] [PubMed] [Google Scholar]
- 36.Kim AJ, Fenk LM, Lyu C & Maimon G Quantitative Predictions Orchestrate Visual Signaling in Drosophila. Cell 168, 280–294 e212, doi: 10.1016/j.cell.2016.12.005 (2017). [DOI] [PMC free article] [PubMed] [Google Scholar]
- 37.Tracey KJ Reflex control of immunity. Nat Rev Immunol 9, 418–428, doi: 10.1038/nri2566 (2009). [DOI] [PMC free article] [PubMed] [Google Scholar]
- 38.Babcock DT, Landry C & Galko MJ Cytokine signaling mediates UV-induced nociceptive sensitization in Drosophila larvae. Curr Biol 19, 799–806, doi: 10.1016/j.cub.2009.03.062 (2009). [DOI] [PMC free article] [PubMed] [Google Scholar]
- 39.Andersen DS et al. The Drosophila TNF receptor Grindelwald couples loss of cell polarity and neoplastic growth. Nature 522, 482–486, doi: 10.1038/nature14298 (2015). [DOI] [PubMed] [Google Scholar]
- 40.Kanda H, Igaki T, Kanuka H, Yagi T & Miura M Wengen, a member of the Drosophila tumor necrosis factor receptor superfamily, is required for Eiger signaling. J Biol Chem 277, 28372–28375, doi: 10.1074/jbc.C200324200 (2002). [DOI] [PubMed] [Google Scholar]
- 41.Doupe DP, Marshall OJ, Dayton H, Brand AH & Perrimon N Drosophila intestinal stem and progenitor cells are major sources and regulators of homeostatic niche signals. Proc Natl Acad Sci U S A 115, 12218–12223, doi: 10.1073/pnas.1719169115 (2018). [DOI] [PMC free article] [PubMed] [Google Scholar]
- 42.Harmansa S, Alborelli I, Bieli D, Caussinus E & Affolter M A nanobody-based toolset to investigate the role of protein localization and dispersal in Drosophila. Elife 6, doi: 10.7554/eLife.22549 (2017). [DOI] [PMC free article] [PubMed] [Google Scholar]
- 43.Heir R & Stellwagen D TNF-Mediated Homeostatic Synaptic Plasticity: From in vitro to in vivo Models. Front Cell Neurosci 14, 565841, doi: 10.3389/fncel.2020.565841 (2020). [DOI] [PMC free article] [PubMed] [Google Scholar]
- 44.Petsakou A, Sapsis TP & Blau J Circadian Rhythms in Rho1 Activity Regulate Neuronal Plasticity and Network Hierarchy. Cell 162, 823–835, doi: 10.1016/j.cell.2015.07.010 (2015). [DOI] [PMC free article] [PubMed] [Google Scholar]
- 45.Ariyapala IS et al. Identification of Split-GAL4 Drivers and Enhancers That Allow Regional Cell Type Manipulations of the Drosophila melanogaster Intestine. Genetics 216, 891–903, doi: 10.1534/genetics.120.303625 (2020). [DOI] [PMC free article] [PubMed] [Google Scholar]
- 46.Petsakou A & Perrimon N Bioelectric regulation of intestinal stem cells. Trends Cell Biol, doi: 10.1016/j.tcb.2022.10.003 (2022). [DOI] [PMC free article] [PubMed] [Google Scholar]
- 47.Harris MP Bioelectric signaling as a unique regulator of development and regeneration. Development 148, doi: 10.1242/dev.180794 (2021). [DOI] [PMC free article] [PubMed] [Google Scholar]
- 48.Ho KYL, Khadilkar RJ, Carr RL & Tanentzapf G A gap-junction-mediated, calcium-signaling network controls blood progenitor fate decisions in hematopoiesis. Curr Biol 31, 4697–4712 e4696, doi: 10.1016/j.cub.2021.08.027 (2021). [DOI] [PubMed] [Google Scholar]
- 49.Dajas-Bailador FA, Mogg AJ & Wonnacott S Intracellular Ca2+ signals evoked by stimulation of nicotinic acetylcholine receptors in SH-SY5Y cells: contribution of voltage-operated Ca2+ channels and Ca2+ stores. J Neurochem 81, 606–614, doi: 10.1046/j.1471-4159.2002.00846.x (2002). [DOI] [PubMed] [Google Scholar]
- 50.Kim AA et al. Independently paced Ca2+ oscillations in progenitor and differentiated cells in an ex vivo epithelial organ. J Cell Sci 135, doi: 10.1242/jcs.260249 (2022). [DOI] [PMC free article] [PubMed] [Google Scholar]
Additional References:
- 51.Phillips MD & Thomas GH Brush border spectrin is required for early endosome recycling in Drosophila. J Cell Sci 119, 1361–1370, doi: 10.1242/jcs.02839 (2006). [DOI] [PubMed] [Google Scholar]
- 52.Diao F et al. Plug-and-play genetic access to drosophila cell types using exchangeable exon cassettes. Cell Rep 10, 1410–1421, doi: 10.1016/j.celrep.2015.01.059 (2015). [DOI] [PMC free article] [PubMed] [Google Scholar]
- 53.Jenett A et al. A GAL4-driver line resource for Drosophila neurobiology. Cell Rep 2, 991–1001, doi: 10.1016/j.celrep.2012.09.011 (2012). [DOI] [PMC free article] [PubMed] [Google Scholar]
- 54.Ariyapala IS et al. Identification of Split-GAL4 Drivers and Enhancers That Allow Regional Cell Type Manipulations of the Drosophila melanogaster Intestine. Genetics 216, 891–903, doi: 10.1534/genetics.120.303625 (2020). [DOI] [PMC free article] [PubMed] [Google Scholar]
- 55.McGuire SE, Mao Z & Davis RL Spatiotemporal gene expression targeting with the TARGET and gene-switch systems in Drosophila. Sci STKE 2004, pl6, doi: 10.1126/stke.2202004pl6 (2004). [DOI] [PubMed] [Google Scholar]
- 56.Brand AH & Perrimon N Targeted gene expression as a means of altering cell fates and generating dominant phenotypes. Development 118, 401–415 (1993). [DOI] [PubMed] [Google Scholar]
- 57.Dana H et al. High-performance calcium sensors for imaging activity in neuronal populations and microcompartments. Nat Methods 16, 649–657, doi: 10.1038/s41592-019-0435-6 (2019). [DOI] [PubMed] [Google Scholar]
- 58.Lin S, Ewen-Campen B, Ni X, Housden BE & Perrimon N In Vivo Transcriptional Activation Using CRISPR/Cas9 in Drosophila. Genetics 201, 433–442, doi: 10.1534/genetics.115.181065 (2015). [DOI] [PMC free article] [PubMed] [Google Scholar]
- 59.Perkins LA et al. The Transgenic RNAi Project at Harvard Medical School: Resources and Validation. Genetics 201, 843–852, doi: 10.1534/genetics.115.180208 (2015). [DOI] [PMC free article] [PubMed] [Google Scholar]
- 60.Masuyama K, Zhang Y, Rao Y & Wang JW Mapping neural circuits with activity-dependent nuclear import of a transcription factor. J Neurogenet 26, 89–102, doi: 10.3109/01677063.2011.642910 (2012). [DOI] [PMC free article] [PubMed] [Google Scholar]
- 61.Chakraborty S et al. Mutant IP3 receptors attenuate store-operated Ca2+ entry by destabilizing STIM-Orai interactions in Drosophila neurons. J Cell Sci 129, 3903–3910, doi: 10.1242/jcs.191585 (2016). [DOI] [PMC free article] [PubMed] [Google Scholar]
- 62.Nern A, Pfeiffer BD & Rubin GM Optimized tools for multicolor stochastic labeling reveal diverse stereotyped cell arrangements in the fly visual system. Proc Natl Acad Sci U S A 112, E2967–2976, doi: 10.1073/pnas.1506763112 (2015). [DOI] [PMC free article] [PubMed] [Google Scholar]
- 63.Yagi R, Mayer F & Basler K Refined LexA transactivators and their use in combination with the Drosophila Gal4 system. Proc Natl Acad Sci U S A 107, 16166–16171, doi: 10.1073/pnas.1005957107 (2010). [DOI] [PMC free article] [PubMed] [Google Scholar]
- 64.Kitamoto T Conditional modification of behavior in Drosophila by targeted expression of a temperature-sensitive shibire allele in defined neurons. J Neurobiol 47, 81–92, doi: 10.1002/neu.1018 (2001). [DOI] [PubMed] [Google Scholar]
- 65.Jovanic T et al. Competitive Disinhibition Mediates Behavioral Choice and Sequences in Drosophila. Cell 167, 858–870 e819, doi: 10.1016/j.cell.2016.09.009 (2016). [DOI] [PubMed] [Google Scholar]
- 66.Potter CJ, Tasic B, Russler EV, Liang L & Luo L The Q system: a repressible binary system for transgene expression, lineage tracing, and mosaic analysis. Cell 141, 536–548, doi: 10.1016/j.cell.2010.02.025 (2010). [DOI] [PMC free article] [PubMed] [Google Scholar]
- 67.Hamada FN et al. An internal thermal sensor controlling temperature preference in Drosophila. Nature 454, 217–220, doi: 10.1038/nature07001 (2008). [DOI] [PMC free article] [PubMed] [Google Scholar]
- 68.Nicolai LJ et al. Genetically encoded dendritic marker sheds light on neuronal connectivity in Drosophila. Proc Natl Acad Sci U S A 107, 20553–20558, doi: 10.1073/pnas.1010198107 (2010). [DOI] [PMC free article] [PubMed] [Google Scholar]
- 69.Harmansa S, Alborelli I, Bieli D, Caussinus E & Affolter M A nanobody-based toolset to investigate the role of protein localization and dispersal in Drosophila. Elife 6, doi: 10.7554/eLife.22549 (2017). [DOI] [PMC free article] [PubMed] [Google Scholar]
- 70.Harrisingh MC, Wu Y, Lnenicka GA & Nitabach MN Intracellular Ca2+ regulates free-running circadian clock oscillation in vivo. J Neurosci 27, 12489–12499, doi: 10.1523/JNEUROSCI.3680-07.2007 (2007). [DOI] [PMC free article] [PubMed] [Google Scholar]
- 71.Nagarkar-Jaiswal S et al. A library of MiMICs allows tagging of genes and reversible, spatial and temporal knockdown of proteins in Drosophila. Elife 4, doi: 10.7554/eLife.05338 (2015). [DOI] [PMC free article] [PubMed] [Google Scholar]
- 72.Ni JQ et al. A genome-scale shRNA resource for transgenic RNAi in Drosophila. Nat Methods 8, 405–407, doi: 10.1038/nmeth.1592 (2011). [DOI] [PMC free article] [PubMed] [Google Scholar]
- 73.Riabinina O et al. Improved and expanded Q-system reagents for genetic manipulations. Nat Methods 12, 219–222, 215 p following 222, doi: 10.1038/nmeth.3250 (2015). [DOI] [PMC free article] [PubMed] [Google Scholar]
- 74.Gratz SJ, Harrison MM, Wildonger J & O'Connor-Giles KM Precise Genome Editing of Drosophila with CRISPR RNA-Guided Cas9. Methods Mol Biol 1311, 335–348, doi: 10.1007/978-1-4939-2687-9_22 (2015). [DOI] [PMC free article] [PubMed] [Google Scholar]
- 75.Port F, Chen HM, Lee T & Bullock SL Optimized CRISPR/Cas tools for efficient germline and somatic genome engineering in Drosophila. Proc Natl Acad Sci U S A 111, E2967–2976, doi: 10.1073/pnas.1405500111 (2014). [DOI] [PMC free article] [PubMed] [Google Scholar]
- 76.Buchon N, Broderick NA, Poidevin M, Pradervand S & Lemaitre B Drosophila intestinal response to bacterial infection: activation of host defense and stem cell proliferation. Cell Host Microbe 5, 200–211, doi: 10.1016/j.chom.2009.01.003 (2009). [DOI] [PubMed] [Google Scholar]
- 77.Ren F et al. Hippo signaling regulates Drosophila intestine stem cell proliferation through multiple pathways. Proc Natl Acad Sci U S A 107, 21064–21069, doi: 10.1073/pnas.1012759107 (2010). [DOI] [PMC free article] [PubMed] [Google Scholar]
- 78.Amcheslavsky A, Jiang J & Ip YT Tissue damage-induced intestinal stem cell division in Drosophila. Cell Stem Cell 4, 49–61, doi: 10.1016/j.stem.2008.10.016 (2009). [DOI] [PMC free article] [PubMed] [Google Scholar]
- 79.Kim K et al. Drosophila as a model for studying cystic fibrosis pathophysiology of the gastrointestinal system. Proc Natl Acad Sci U S A 117, 10357–10367, doi: 10.1073/pnas.1913127117 (2020). [DOI] [PMC free article] [PubMed] [Google Scholar]
- 80.Asano SM et al. Expansion Microscopy: Protocols for Imaging Proteins and RNA in Cells and Tissues. Curr Protoc Cell Biol 80, e56, doi: 10.1002/cpcb.56 (2018). [DOI] [PMC free article] [PubMed] [Google Scholar]
- 81.Li H et al. Fly Cell Atlas: A single-nucleus transcriptomic atlas of the adult fruit fly. Science 375, eabk2432, doi: 10.1126/science.abk2432 (2022). [DOI] [PMC free article] [PubMed] [Google Scholar]
- 82.Hu Y et al. FlyRNAi.org-the database of the Drosophila RNAi screening center and transgenic RNAi project: 2017 update. Nucleic Acids Res 45, D672–D678, doi: 10.1093/nar/gkw977 (2017). [DOI] [PMC free article] [PubMed] [Google Scholar]
- 83.Satyanarayan A, Moritz D, Wongsuphasawat K & Heer J Vega-Lite: A Grammar of Interactive Graphics. IEEE Trans Vis Comput Graph 23, 341–350, doi: 10.1109/TVCG.2016.2599030 (2017). [DOI] [PubMed] [Google Scholar]
- 84.Hung RJ et al. A cell atlas of the adult Drosophila midgut. Proc Natl Acad Sci U S A 117, 1514–1523, doi: 10.1073/pnas.1916820117 (2020). [DOI] [PMC free article] [PubMed] [Google Scholar]
- 85.Chen J, Xu N, Huang H, Cai T & Xi R A feedback amplification loop between stem cells and their progeny promotes tissue regeneration and tumorigenesis. Elife 5, doi: 10.7554/eLife.14330 (2016). [DOI] [PMC free article] [PubMed] [Google Scholar]
- 86. https://app.biorender.com .
Associated Data
This section collects any data citations, data availability statements, or supplementary materials included in this article.
Supplementary Materials
Data Availability Statement
Raw data from main and Extended Data Figures are available in the Source Data files provided with this work. Reagents are available upon request. The snRNA-seq datasets generated in this work are publicly available in the Gene Expression Omnibus (GEO) databases under GSE218641 accession code.
GSE218641: [https://www.ncbi.nlm.nih.gov/geo/query/acc.cgi?acc=GSE218641], snRNA-seq dataset of gut from Ore R females flies during Homeostasis and Recovery
Single-nuclei profiling data from this study can be found at https://www.flyrnai.org/tools/rna_seq_base/web/showProject/39/plot_coord=1/sample_id=all , to allow users to query the expression of any gene of interest.
All other data are available in Figures, Ext. Data Figures and SI files (SI, SI figure, S. videos, S. Tables)
This study does not use any custom codes for analysis. snRNA-seq dataset were analyzed using standard Seurat pipeline.


