ABSTRACT
The LMNA gene encoding lamin A/C is amplified in some clear cell renal cell carcinoma (ccRCC) samples. Our data showed that depletion of the tumor suppressor PBRM1 can upregulate lamin A/C levels, and lamin A/C could interact with PBRM1. However, the role of lamin A/C in ccRCC is not yet fully understood. Our functional assays showed that although the proliferation ability was slightly impaired after LMNA depletion, the migration and invasion of ccRCC cells were significantly inhibited. This suppression was accompanied by a reduction in MMP2, MMP9, AKT/p-AKT, and Wnt/β-catenin protein levels. Our data therefore suggest that lamin A/C, as an interaction partner of the tumor suppressor PBRM1, plays a crucial role in tumor invasion and metastasis in ccRCC.
KEYWORDS: ccRCC, LMNA, PBRM1, PI3K/AKT, β-catenin
Introduction
Kidney cancer is a common tumor of the urinary system, with the rate of incidence accounting for 3% ~ 5% of all tumors [1]. About 30% of the patients have metastasized at the time of diagnosis, so markers for early detection and molecules applicable for stratification and druggable targets are greatly desired. Clear cell renal cell carcinoma (ccRCC) is the most common histologic type of kidney cancer.
We examined the mutated or amplified cancer genes in the TCGA database (ccRCC clinical samples, Provisional) using the cBioPortal platform (https://www.cbioportal.org/). Our analysis showed that PBRM1 is highly mutated (~40%) in ccRCC as previously reported [2] and the copy number variation of lamin A/C family genes in ccRCC can be as high as 13.8% (refer to Figure 1(d)). This suggests that lamin proteins might play a role in ccRCC as PBRM1 does [3]. Lamins are intermediate filament proteins in the nucleus of metazoan cells [4–6]. In mammals, there are 3 lamin genes, namely LMNA, LMNB1and LMNB2, which encode at least 7 variants through different exon splicing [5]. Lamin proteins can be categorized into 2 subgroups A-and B-type lamins [7]. Lamin B proteins are encoded by either LMNB1 or LMNB2. Lamin A and C are major isoforms of Type-A, which are different splices of LMNA. Although lamin C has 98 amino acids less than lamin A, lamin A/C are always researched together due to the fact that the lamin A has the same amino terminal with lamin C [8]. At least one B-type lamin is universal expressed in mammalian cells, whereas A-type lamins are expressed mainly in differentiated cells [5]. Reduction or increase of lamin A/C expression are both reported in cancer cells. It has been reported that increased lamin A/C level was observed in high-risk prostate tumors which was associated with the malignant behavior of tumor cells [9]. It was also observed in hepatocellular carcinoma (HCC) where LMNA functions as an oncogene [10]. Lamin A, together with other molecules, is recommended to use as clinical biomarkers for prostate cancer [11,12]. It has been reported that increased ccRCC aggressiveness was reflected by an altered Wnt1/β-catenin signaling [13]. However, it is unclear whether lamin A/C has an oncogenic role in ccRCC similar to that in prostate cancer and HCC.
Figure 1.
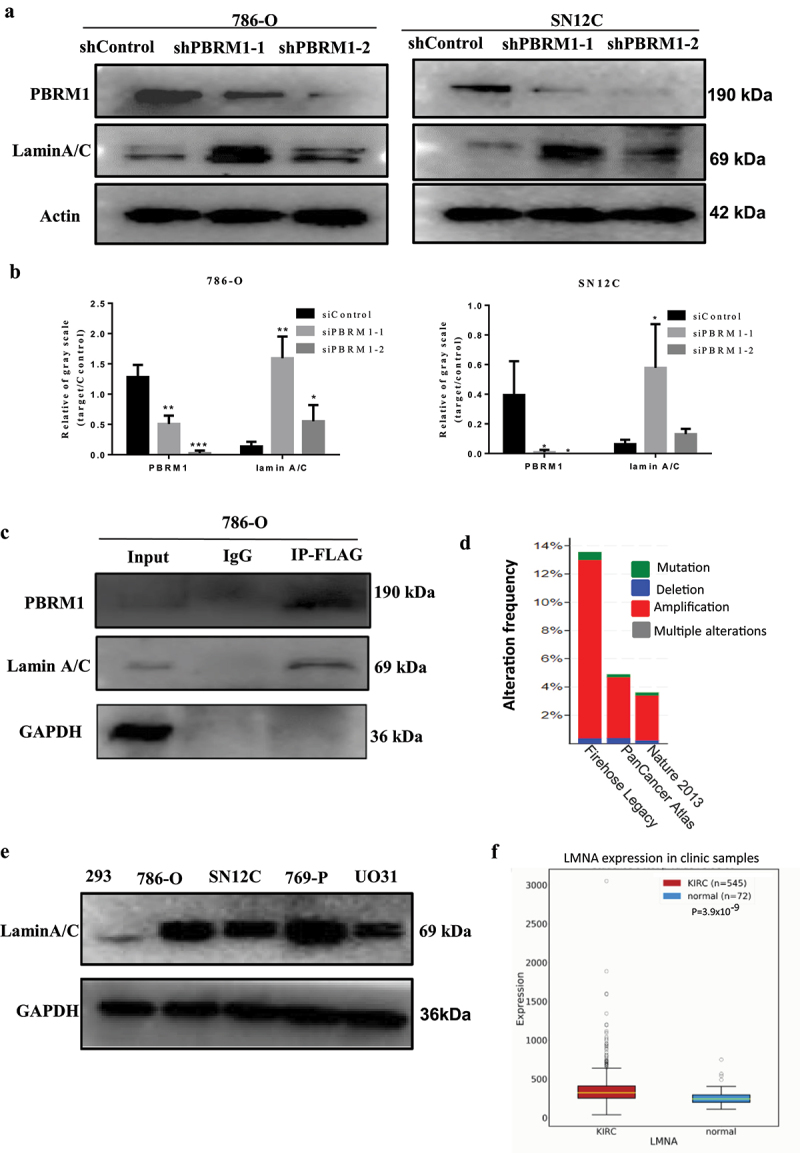
Lamin A/C interacts with PBRM1 and amplification of lamin gene family members occurs in ccRCC samples. a) established stable PBRM1knockdown cell lines showing a remarkable reduction in PBRM1 expression at the protein level in 786-O and SN12C cells; b) quantification of Western blot results. c) Co-IP analysis showed that lamin A/C was apparently enriched after PBRM1 pulldown, indicating that lamin A/C interacts with PBRM1; d) analysis of the ccRCC clinical samples (TCGA data, provisional) showed that the CNVs (copy number variations) for members of the lamin A/C gene family can be as high as 13.8% and the majority is amplification; e) lamin A/C was highly expressed in RCC cells including 786-O and SN12C cells; f) LMNA is upregulated in RCC clinical specimens compared to adjacent control tissue (KIRC, OncoDB RCC dataset). (*p < .05; **p < .01; ***p < .001).
It is known that lamin A/C plays a key role in chromatin organization [14]. However, whether there are relationships between lamin A/C and other chromatin organizers such as PBRM1 remains to be elucidated. PBRM1 is mapped to chromosome 3p, which encodes the Polybromo 1 protein, or BRG1-associated factor 180 (PBRM1/PB1/BAF180), the specific subunit PBAF complex [15,16]. Though some progresses have been achieved but the mechanism of PBRM1 functioning as a tumor suppressor in ccRCC remains unclear. We recently demonstrated that deficient PBRM1 activates AKT-TOR signaling pathway [3], but if LMNA can function similarly is still unclear yet.
We carried out this study with RNAi, Western Blotting, qRT-PCR, cell proliferation and migration assays, in an attempt to understand the role of LMNA(encoding lamin A/C) in ccRCC cells and its molecular mechanisms, and whether there are any relationship between lamin A/C and tumor suppressor PBRM1. Our data provide new insights into the functional role of LMNA and PBRM1 in ccRCC cells.
Materials and methods
Cell culture, antibodies, and reagents
The kidney cancer cell lines 786-O and SN12C were routinely maintained in RPMI medium supplemented with 10% fetal bovine serum, penicillin, and streptomycin in a 37°C incubator at 5% CO2.
The following antibodies were used in this study: Lamin A/C (Santa Cruz, sc-7292), Lamin A/C (HUABIO, ET7110–12), PBRM1(Bethyl, A301-591A), GAPDH (Proteintech, 60004–1), normal mouse IgG (Santa Cruz, K1017), FLAG(HUABIO, M1403–2), MMP2 (HUABIO, ET1606–4), MMP9 (HUABIO, ET1704–69), β-catenin (HUABIO, ET1601–5), AKT1 (HUABIO, EM40507), p-AKT1 (HUABIO, ET1607–73)(Ser473), Goat anti-mouse IgG-Alexa Fluor 488 antibody (HUABIO, HA1111), WNT3A (Proteintech, 26744–1-AP), PI3K (HUABIO, ET1608–70), Histone H3 (HUABIO, M1309–1). BeyoClick™ EdU-488 (Beyotime Biotechnology, C0071S) was purchased for EdU assay. Matrigel matrix (Corning Matrigel matrix, #356234) was purchased for transwell invasion assay.
RNA interfering
RNA interfering assay was performed according to the manufacturer’s instructions. siRNAs for LMNA and control siRNA were ordered from GenePharma (Shanghai, China). In brief, 6 × 10⁵ cells of 786-O or SN12C were inoculated per well in 6-well plates. The transfection was performed when the cell density was about 60%. Negative Control or siLMNA-1/siLMNA-2 were used at a final concentration of 80 nmol/L together with siRNA-mate reagent (GenePharma, Shanghai, China). Total RNA was prepared after transfection for 48 h, and cells were collected after transfection for 72 h. The two siRNAs, namely siRNA-1 and siRNA-2 were used in the following experiments. Then, Western Blotting and qRT-PCR assays were carried out to examine the knockdown effects.
For lentivirus transfection, the lentiviruses with shRNA targeting the PBRM1 gene were purchased from Shanghai Genepharma and Santa Cruz. The stably knockdown PBRM1 cell lines were obtained by selecting the cells with puromycin. All RNAi sequences are available upon request.
RNA extraction, cDNA synthesis, and quantitative PCR
Gene expression analysis was performed as mentioned previously [17]. In brief, the cells were washed with PBS and total RNA was collected using Trizol reagent (Solarbio, Beijing, China). The RNA was purified with isopropanol precipitation. cDNA synthesis was performed with PrimeScriptTM RT reagent Kit (Perfect Real Time, Takara). Quantitative PCR (qPCR) was carried out with SensiFAST SYBR reagents (Bioline, UK) on the Bio-Rad CFX 96 system. GAPDH was used as an internal reference. All primer sequences are available upon request.
Western blotting assay
The Western blotting assays were performed similarly as previously reported [17]. In brief, SN12C or 786-O cells were lysed in RIPA buffer containing PMSF (1 μM) and protease inhibitor cocktail (Roche Applied Science) for 30 min on ice with vortexing for 10 seconds every 10 min. The lysates were centrifuged, separated by 10% SDS-PAGE, and transferred to a methanol-activated PVDF membrane. The blots were stained with ECL reagents (RPN2132, GE Healthcare) and analyzed by Gel Doc XR system (Bio-Rad, USA). For nuclear protein separation, the ExKine kit (KTP3001) was used according to the manufacturer’s instructions.
Nuclear morphology and lamin A/C immunofluorescence observation
After 48 hours of siLMNA treatment, 786-O cells were trypsinized, counted, and 4 × 10⁴ cells were plated in 6-well plates per well. For SN12C cells, 1 × 10⁵ cells per well were plated. After incubating for 24 hours, the cells were washed twice with PBS, then fixed with 4% paraformaldehyde for 20 minutes at room temperature. After washing the cells for 3 times with PB, the cells were blocked with 3% BSA in TBST (containing 0.3% Triton) and incubated with antibody against Lamin A in a humidified chamber overnight at 4°C. Then the cells were incubated with the secondary antibody conjugated with FITC for 1 h at room temperature. After washing with PBS, the nuclei were counterstained with DAPI dye. The samples were then observed under a fluorescence microscope.
Nuclear morphology was further evaluated using image J as depicted [18]. In short, 16-bit photomicrographs of DAPI-stained nuclei were converted to 8-bit images before being converted to binary photos utilizing the standard Make Binary function in ImageJ. Touching cell nuclei were separated by the ‘Watershed’ function and tiny fragments of nuclei were discarded on the basis of area by the ‘Analyze Particle’ function and the area or perimeter was obtained for further statistical analysis.
Co-immunoprecipitation assay
786-O cells grown in 10-cm tissue culture plates were transiently transfected with WT PBRM1-TRIPZ-neo (Addgene, USA) using Lipofectamine 3000 (Invitrogen) for 48 h. Then, 786-O cells overexpressing PB1-FLAG after being screened with G418 (neomycin analogue) for 72 hours were treated with Dox with a final concentration of 2 μg/ml for 9 days. Next, cells were lysed with 1 ml of the mixture of lysis buffer[1 ml 1 M HEPES (pH 7.9),1.5 ml 5 M NaCl,0.05 ml 0.5 M EDTA(pH 8.0),0.15 ml Triton X-100,0.25 ml NP-40,0.25 ml 2.5 M KCl,0.075 ml 1 M MgCl2,5 ml glycerol,41.775 ml ddH2O], 10 mM PMSF and 100× protease inhibitor at the ratio of 10:1:1 on ice for 45 min. Cell lysates were centrifuged at 12,000 rpm for 10 min at 4°C. The supernatants were subsequently collected and pre-incubated with rec-Protein A-Sepharose 4B with gentle shaking at 4°C for 3 h to remove nonspecific proteins bound to the beads. Then, the supernatants were incubated with antibody and rec-Protein A-Sepharose 4B beads overnight at 4°C. After centrifugation, immunocomplexes were washed with lysis buffer and analyzed by Western blotting using antibodies against Lamin A/C (1:1000), PBRM1 (1:500), FLAG(1:1000),GAPDH (1:5000), and normal mouse IgG(1: 5000).
Proliferation assay
After 48 hours of siRNAs treatment, 786-O cells and SN12C cells were treated with trypsin in 6-well plates and counted using a hemocytometer. 2500 cells were seeded to each well of 96-well plates.
20 μL of MTT solution was added into each well at fixed time points, followed by incubation for 2 hours. The medium was removed and 20 μL of DMSO was added before measuring the absorbance at 490 nm with a Microplate Reader.
EdU assay was performed according to the manufacturer’s instructions. In brief, 1.25 × 10⁵ cells were plated on coverslips per well. The next day 500 μl of EdU (10 μM) was added to each well and continuously incubated at 37°C. Then the cells were fixed with 4% formaldehyde, permeabilized with 0.3% Triton® X-100 in PBS. EdU detection was carried out by incubating the cells with 500 μl of iClick reaction cocktail for 40 minutes at room temperature. The cells were then washed with PBS and nuclei were counterstained with Hoechst 33,342.
Wound healing assay
After 786-O cells and SN12C cells were treated with siRNA for 48 hours, 1 × 10⁵ cells were seeded to each well of a 6-well plate and grow in complete RPMI medium. The next day the medium was replaced with serum-free medium. After starving cells for 24 h, a wound was made using a sterile pipette tip across the cell surface. The wells were washed three times with PBS to remove cell debris and then incubated with serum-free RPMI medium. Five different areas of the wound per well were photographed at 24 h or 36 h under a microscope and analyzed with Photoshop software. The width of the wound was measured and the relative migrating rate was obtained by comparing the widths of given time points over that of zero time points. Three individual replicates were performed.
Transwell invasion assay
The invasion experiment was carried out using a transwell matrigel invasion assay in 24-well Transwell chambers (8 μm pore size) units. Matrigel (Corning Matrigel matrix, #356234) was diluted with the precooled serum-free RPMI 1640 (25–30 μl) was added to the upper chamber of the Transwell and incubated at 37°C for 30 minutes. After 48 hours of siRNA treatment, 786-O cells and SN12C cells were suspended in RPMI, then 3 × 10⁴ 786-O or 6 × 10⁴ SN12C cells each in 200ul RPMI1640 medium were transferred to matrigel-coated top chambers. The lower chambers were filled with 600 μl RPMI1640 containing 20% fetal bovine serum as a chemical attractant. After culturing for 24 h, the non-invading cells were removed and the inserts were washed with PBS and fixed with 4% paraformaldehyde. After the cells were stained with 0.1% crystal violet solution for 25 min at room temperature and gently rinsing with distilled water, five fields were randomly selected and the invaded cells were counted under an inverted microscope. Three individual replicates were performed.
Statistical analysis
Statistical analyses were carried out using GraphPad Prism 7. For cell proliferation and Western Blotting analyses, an unpaired t-test with Welch’s correction was used. Significance was defined at a two-sided alpha level of 0.05.
Results
Lamin A/C was upregulated after stably knockdown of PBRM1
With lentivirus infection, we successfully established PBRM1-knockdown cell lines. Western Blots showed that PBRM1 expression was significantly reduced in both 786-O and SN12C cell lines. Interestingly, the lamin A/C level was upregulated after knockdown of tumor suppressor gene PBRM1 (Figure 1(a,b)). The results of Co-immunoprecipitation assay demonstrated that Lamin A/C is an interacting partner of PBRM1 (Figure 1(c)). Moreover, the analysis of the ccRCC clinic samples (TCGA data) showed that the CNVs (copy number variations) can be up to 13.8% for lamin A/C gene family members and the majority is amplification type (Figure 1(d)) [19,20].
We further checked expression levels and found that lamin A/C was highly expressed in RCC cells including 786-O and SN12C compared to 293 cells. Furthermore, lamin A/C was also significantly upregulated in RCC clinical specimens compared to adjacent control tissue (Figure 1(e)).
Nuclear morphology changed after knockdown of LMNA
Two siRNAs among the total 6 siRNAs we tested, significantly decreased the expression of Lamna A/C at both protein level (Figure 2(a)) and RNA level (Figure 2(b)). The knockdown efficiency is about 50% and thus these two siRNAs were used in the following studies.
Figure 2.
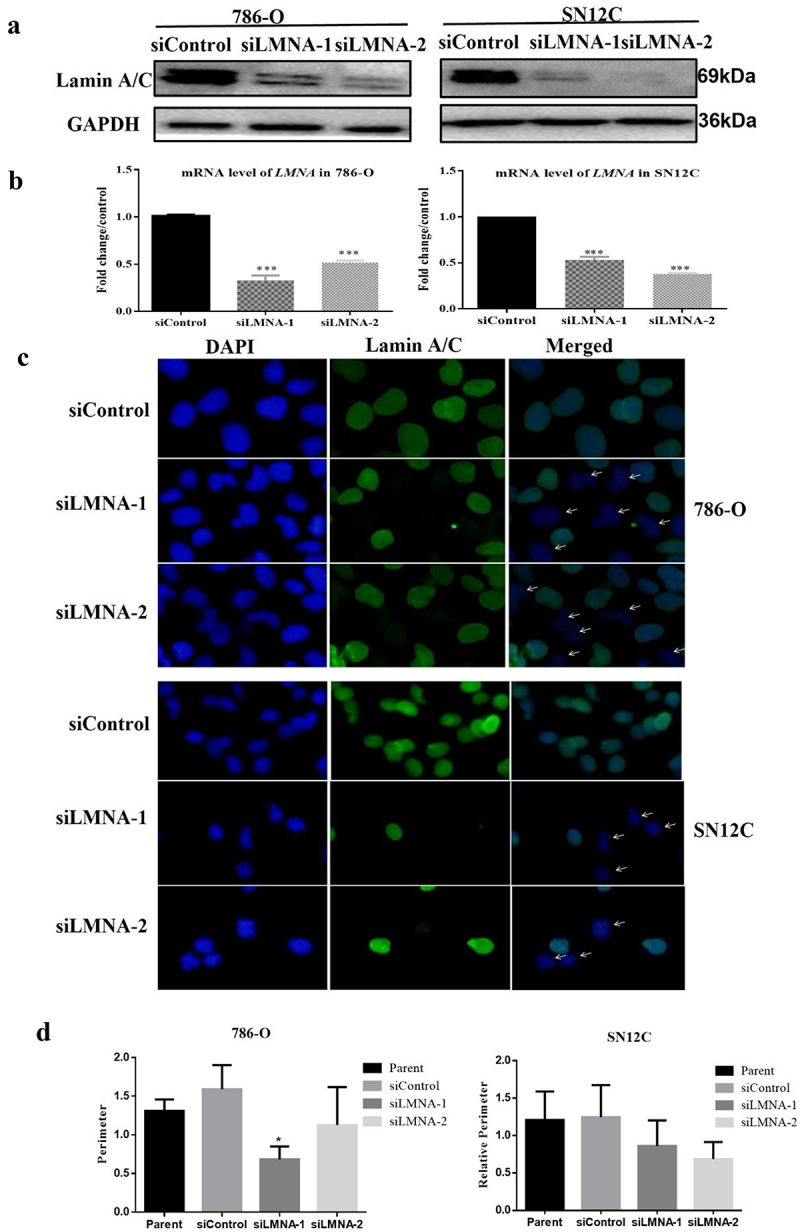
Nuclear morphology changed after knockdown of LMNA. a) Lamna A/C is reduced at the protein level in 786-O cells and SN12C cells when treated with two different siRnas; b) Lamna A/C is reduced at the RNA level in 786-O cells and SN12C cells when treated with two different siRnas; c) left, DAPI staining showing that some nuclei in siLMNA samples have abnormal shapes; middle, immunofluorescence with 1st antibody against lamin A/C and 2nd antibody conjugated with FITC showing the fluorescence distribution in the nuclear region; right, the merged result of DAPI and FITC images. The arrows indicate some nuclei with irregular nuclear contours such as dents can be observed in siLMNA groups, some of the nuclei also lack FITC immunofluorescence due to RNAi of lamin A/C; d) nuclear circumferences were compared and siLMNA-2 treatment significantly reduced nuclear perimeter in 786-O cells; E). The perimeters of the cell nuclei were not significantly affected in SN12C cells. (*p < .05; **p < .01; ***p < .001.).
To examine if the nuclear morphology changes after knockdown of LMNA and the localization of lamin A/C, we performed immunofluorescence assays. The results indicated that lamin A/C is distributed in the nuclear region as expected in both 786-O and SN12C cells (Figure 2(c)). Some nuclei lacked fluorescence, which may reflect the effective knockdown of LMNA in these cells. Accordingly, while normal nuclei were mostly round or ovoid, the nuclei of siLMNA groups showed some abnormalities with irregular nuclear contours such as dents in the nuclear membranes (Figure 2(c)).
Analysis of nuclear morphology using Image J showed that nuclear circumferences were significantly reduced in some siRNA groups (i.e., siLMNA-2) in 786-O cells, although a similar trend could be observed but was not statistically significant. The nuclear area analysis showed similar results (supp Figs S1 and S2).
Knockdown effects of LMNA on the proliferation ability of 786-O and SN12C cells
To examine the effects of knockdown of LMNA on cell proliferation, we performed proliferation assays with MTT reagents. At 0 h, 24 h, 48 h, 72 h and 96 h time points, the proliferation rates for 786-O cells did not show a significant difference between siControl and siLMNA groups except at 24 h (Figure 3(a)), though an inhibition trend was repeatedly observed. The same inhibition trend was also observed for SN12C cells (Figure 3(b)). When we further investigated the effect with the EdU assay. The EdU-positive cells were significantly reduced after knockdown of LMNA for both cell lines (with siLMNA-1) and for SN12C cells (with siLMNA-1 and siLMNA-2) (Figure 4(c,d)). This implies that decreased LMNA level affects cell proliferation in RCC cells.
Figure 3.
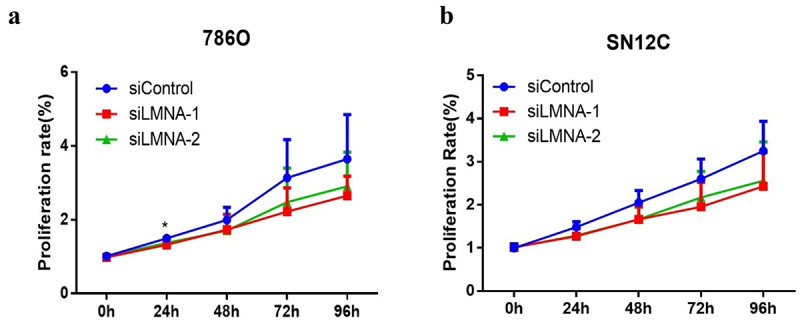
Knockdown of LMNA had a slight effect on the proliferative ability of 786-O and SN12C cells. a) compared to the siControl group, the cells treated with siLMNA did not show significant proliferation capability changes in 786-O cells except at 24 h in MTT assay; b) similar results as above were observed in SN12C cells.
Figure 4.
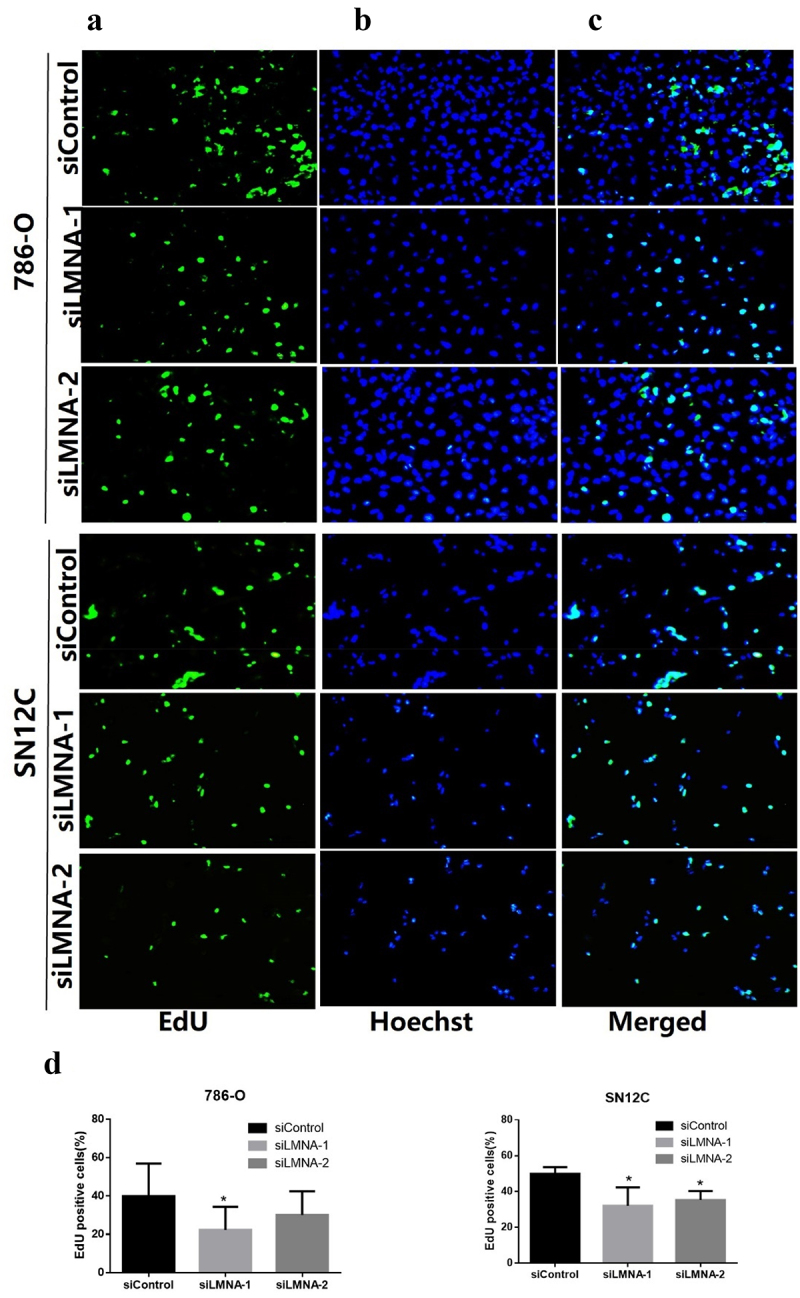
Representative results of EdU assay after knockdown of LMNA. a: EdU detection showing EdU-positive cells (green) in 786-O and SN12C cells; b: nuclei were stained with Hoechst 33,342 (blue); c: merged images showing EdU-positive cells (Cyan); d) the EdU-positive cells were significantly reduced after knockdown of LMNA in 786-O cells (especially with siLMNA-1) and in SN12C cells. (*p < .05).
Knockdown of LMNA inhibited the migration of 786-O and SN12C cells
Since cell proliferation rate was only slightly affected after knockdown of LMNA, we asked whether LMNA plays a role in cell migration. Indeed, we observed a significant difference between the control group and the siLMNA groups in both 786-O and SN12C cells (Figure 5(a-d)). In 786-O cells, the wound healing rate for the siControl group, the siLMNA-1 group and the siLMNA-2 group was 53.43%, 32.84% and 31.06%, respectively. The difference was statistically significant (P < .01). For SN12C cells, the wound healing rate for the siControl group, the siLMNA-1 group and the siLMNA-2 group was 42.63%, 30.18% and 34.48%, respectively. The difference was also statistically significant (P < .01) (Figure 5(a,b)). The transwell invasion assay showed that the number of 786-O cells that passed the Matrigel chamber were 79.00 ± 33.19, 24.33 ± 7.88, and 27.50 ± 11.42 cells for the siControl group, the siLMNA-1 group and the siLMNA-2 group, respectively. The same trend was observed for SN12C cells, namely 124.50 ± 30.22, 45.67 ± 14.73, and 46.33 ± 5.40 cells, respectively. These results indicated that the invasiveness of both LMNA-knockdown cell lines was significantly impaired (Figure 5(c,d)). These results demonstrated that LMNA knockdown inhibited the migration of 786-O and SN12C cells.
Figure 5.
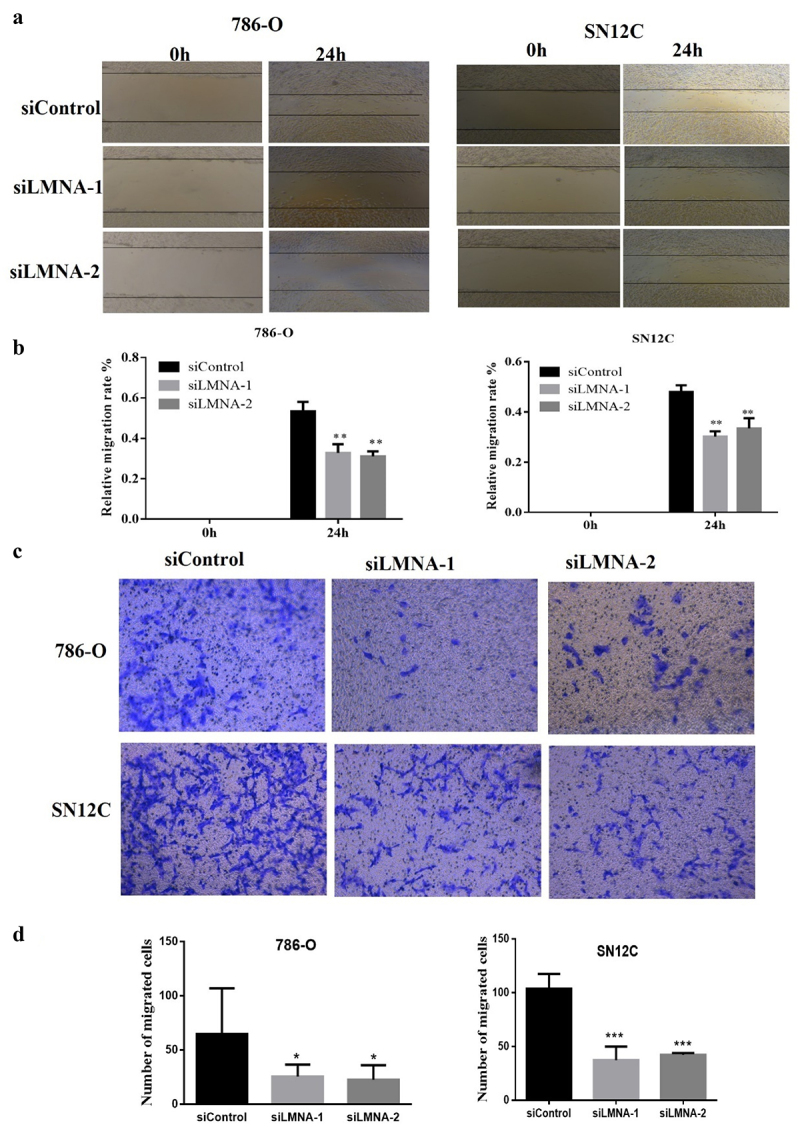
Knockdown of LMNA inhibited the migration and invasion of 786-O and SN12C cells. a) Representative results show that the migratory ability in siLMNA groups in 786-O and SN12C cells was greatly reduced; b) quantitative results of triplicates showing that migratory ability in siLMNA groups was severely reduced in both cell lines; c) Representative results of transwell invasion assays showing that invasiveness was severely impaired in both cell lines; d) quantitative results of duplicates showing that migratory ability was severely impaired in both 786-O and SN12C cells. At least two independent experiments were quantified and expressed as mean SD (*p < .05; **p < .01; ***p < .001).
Knockdown of LMNA decreased the protein levels of MMP2 and MMP9
One of the key features of cell migration and invasion is increased production of matrix metalloproteinases (MMPs), which are capable of cleaving components of the extracellular matrix and molecules. Since the migration capability of these cells was impaired, we next investigated if this was related to key players of cell migration and invasion, such as MMP2 (matrix metallopeptidase 2) and MMP9 (matrix metallopeptidase 9).Western-Blotting revealed that the expression levels of MMP2 and MMP9 in siLMNA group were significantly reduced compared to the control group(Figure 6(a,b)), which confirmed our conjectures.
Figure 6.
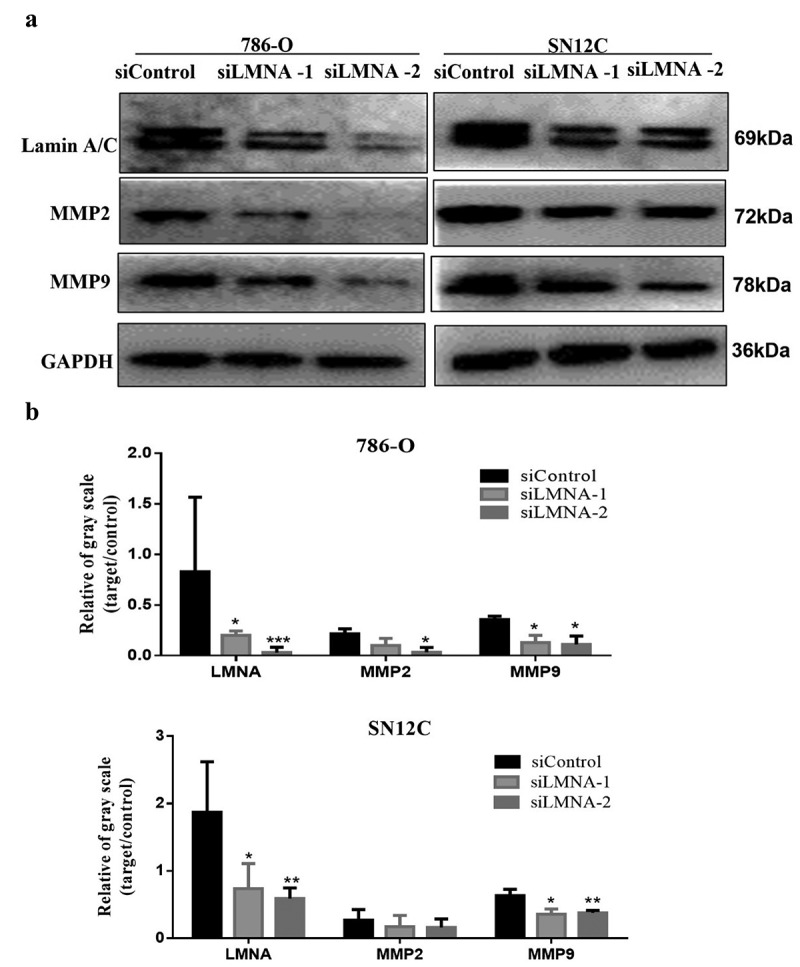
Knockdown of LMNA reduced protein levels of MMP2 and MMP9. a) Western blots showing that protein levels of MMP2 and MMP9 were significantly reduced after knockdown of LMNA. b) Western blot quantitative results showing the significant reduction of MMP2 and MMP9 (*p < .05; **p < .01; ***p < .001).
Knockdown of LMNA reduced the protein levels of akt, p-AKT and β-catenin
We investigated if the protein level changes of MMP2 and MMP9 were associated with dysregulation of PI3K/AKT signaling pathway since PI3K/AKT signaling pathway plays a role in cell migration. Our results showed that the protein levels of AKT1 and p-AKT1 were significantly reduced in experimental groups (siLMNA treated) compared to the control group. However, we also observed that the PI3K level was increased unexpectedly after knockdown of LMNA. The mechanism remains to be determined(Figure 7(a,b)).We further studied if the expression changes of MMP2, MMP9, and AKT were also associated with dysregulation of the Wnt/β-catenin signaling pathway, since β-catenin can function as a downstream effector of PI3K/AKT [21–23], and lamin A/C also plays a role in β-catenin signaling. The result of Western blotting did show a decrease of WNT3A and β-catenin levels in siLMNA groups compared with the control group(Figure 7(a-c)). As expected, our preliminary data also showed that the nuclear β-catenin levels decreased after LMNA knockdown (supp Fig S3).
Figure 7.
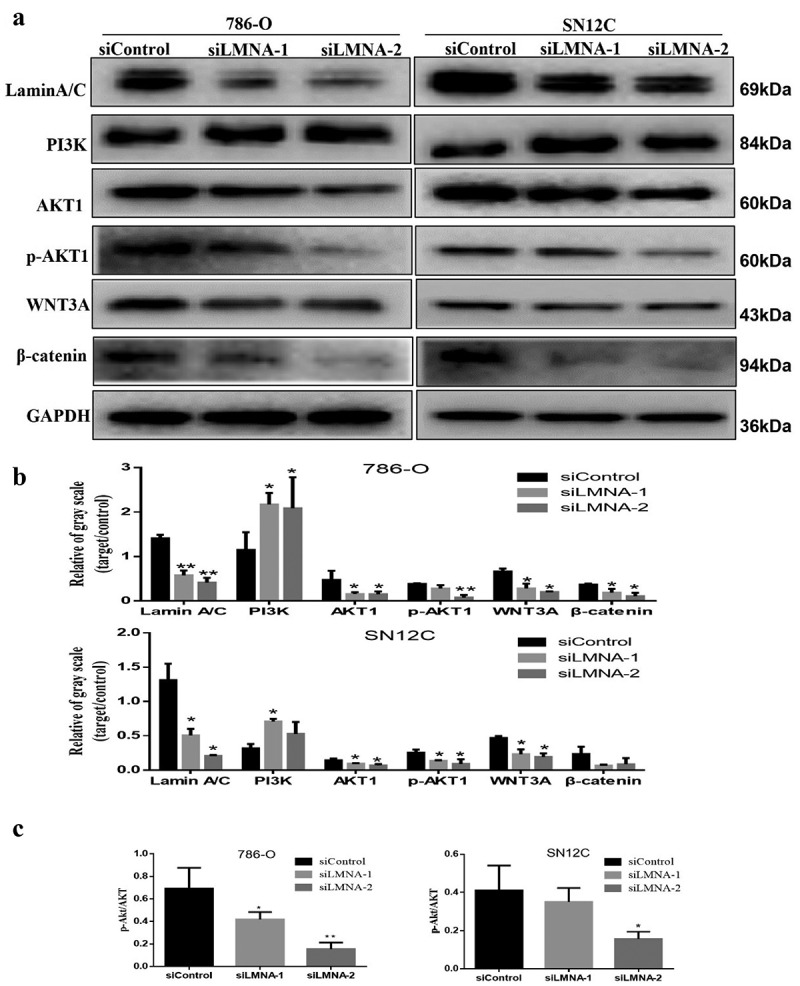
Knockdown of LMNA decreased protein levels of AKT1/p-AKT1 and β-catenin in 786-O and SN12C cells. a) AKT1, p-AKT1 andβ-catenin levels were reduced after knockdown of LMNA in 786-O cells and SN12C cells respectively, but PI3K level was increased; b) Western blotting results were quantified. GAPDH was used as an internal reference for normalization; c) the relative p-AKT/AKT level was examined for both cell lines. (*p < .05; **p < .01; ***p < .001).
Discussion
Although PBRM1 is the second most frequently mutated gene in ccRCC, the mechanism remains largely undetermined. Furthermore, our analysis with the TCGA database revealed that amplification of LMNA and other family members (CNVs) occurs in a subset of ccRCC samples, but whether these CNVs play a role in ccRCC is unclear. Interestingly, our finding that PBRM1 deficiency upregulates lamin A/C levels provides a novel link between this tumor suppressor and the nuclear skeletal component, namely lamin A/C.
It is known that lamin A/C is a nuclear protein, which is the major component of the nuclear. We examined the localization of lamin A/C and the effects of knockdown of lamin A/C on the nuclear morphology. With two siRNAs targeting different regions of LMNA, we successfully reduced the expression of LMNA at both protein and mRNA levels. Our immunofluorescence assay data confirmed the distribution of lamin A/C in ccRCC nuclei. Lamin A/C plays an important role in maintaining proper nuclear morphology, and one of the most obvious effects of depleting lamin A/C is deformed nuclear morphology [24,25]. Moreover, we also observed that the abnormal nuclear shape changes after knockdown of LMNA as previously reported [26]. This nuclear shape abnormality may result from the interaction between lamin A/C and microtubules as reported [27]. And this deformed nuclear morphology could be related to the phenotype associated with senescence as in fibroblasts [28] but this needs further investigation.
It has been shown that a low level of A-type lamins was observed in the proliferating epithelial cells [29], while overexpression of lamin A has been shown to inhibit cell proliferation [30]. In this study, our data did not show very significant differences between the control group and siLMNA groups at selected time points in the MTT assay, but the EdU assay did show a remarkable decrease in proliferation capability after knockdown of LMNA. This agrees with reports that lamin A/C expression is required for the upregulation of genes related to aggressiveness and stemness [31,32], as well as a recent study that in some cell lines, such as 293T and HepG2 cells, knockout of LMNA decreased cell proliferation [10].
Lamin A/C is believed to play a role in cell migration [9,33–36] and differentiation [37–40]. Lamin A/C has been reported to play a role in allowing circulating tumor cells (CTCs) to reattach and start new tumors in new locations [41]. In addition, it has also been found that lamin A/C can increase cell motility and allow cancer to better invade surrounding tissue and grow [9,42,43]. Indeed, our wound healing and transwell assays clearly showed that cell migration rates were greatly reduced for both 786-O and SN12C cells. This implied that lamin A/C may play critical roles in invasion and metastatic processes in ccRCC. This is consistent with that lack or low level of lamin A/C inhibited HCC cell migration [10]. This shows that lamin A/C not only plays a critical role in maintaining a nucleus’ structure, but also helps protect tumor cells from the stresses they face during tumor invasion and metastasis.
To investigate whether this migration inhibition is also linked to the key molecules involved in the cell migration process, such as MMP2 and MMP9, which degrade the extracellular matrix and facilitate cell invasion in vivo, we examined their protein levels. Our data clearly show that levels of MMP2 and MMP9 were decreased after knockdown of LMNA, indicating the potential role of LMNA in ccRCC during invasion and metastasis.
To further investigate the upstream signaling molecules, we asked whether the PI3K/AKT pathway is involved in this process, since PI3K/AKT is reported to play a role in cell migration/metastasis [33,44,45]. Indeed, our data show that protein levels of AKT and p-AKT were both reduced after LMNA knockdown. However, we observed an increase in protein levels in PI3K that was inconsistent with AKT/p-AKT changes. A possible explanation could be that down-regulation of AKT/p-AKT triggered a positive feedback signal and thus PI3K was increased. Apart from that, our finding that lamin A/C plays a role in invasion and migration processes via AKT and p-AKT is consistent with the studies on prostate cancer and hepatocellular carcinoma [9,10]. This is also consistent with our finding that AKT-mTOR is an important activated signaling pathway in ccRCC [3].
We speculated that CNVs of LMNA in ccRCC might dysregulate cell metastases via the Wnt/β-catenin pathway. We decided to study the Wnt/β-catenin pathway for the following reasons:1) β-catenin can be a downstream effector of PI3K/AKT [22,23] 2) The nuclear lamina connects the cytoskeleton to the nucleoskeleton via Linker of nucleoskeleton and cytoskeleton (LINC) complexes, and lamin A/C is nuclear β-catenin interacting partner [25,46] 3) LMNA overexpression might activate Wnt/β-catenin signaling [38] 4) Wnt/β-catenin signaling is activated in ccRCC samples [13,47]. Furthermore, Wnt can activate mTOR by inhibiting GSK3 without involving β-catenin dependent transcription [48,49]
Indeed, our data indicate that Wnt/β-catenin signaling is dysregulated after knockdown of LMNA, which met our expectations. The decrease in AKT/p-AKT and β-catenin demonstrates the critical role of lamin A/C/AKT/β-catenin in cell invasion, migration, as well as proliferation in ccRCC cells.
It is known that lamin A/C is phosphorylated by the mitotic cyclin-dependent kinase CDK1 and other kinases such as AKT [50,51]. Our data here provide new evidence that a positive feedback loop composed of AKT could sense the lamin A/C level and change its activity accordingly. This suggests that increased through this mechanism, lamin A/C levels can render a variety of cancer cells more susceptible to metastasis by activating the PI3K/AKT pathway.
In summary, our data not only indicate that LMNA may play a crucial role in invasion and metastasis, but also provide new insights into the molecular mechanism of the tumor suppressor PBRM1 in ccRCC. That is, the deficient PBRM1 can facilitate cell invasion and metastasis by activating LMNA/AKT/β-catenin signaling. This implies that lamin A/C/AKT/β-catenin and other related key molecules can be used for diagnosis or as potential drug targets for a subset of ccRCC patients who are either deficient in PBRM1 or amplified in LMNA.
Funding Statement
This work was supported by the grants from National Nature Science Foundation of China [No. 31760321;32360166], Guizhou Province Science and Technology [[2017]1217], Guizhou Province Science and Technology [[2018]1189] and Zunyi Medical University Funding [F-792].
Disclosure statement
No potential conflict of interest was reported by the authors.
Authors’ contributions
Y.F. Pan conceived the experiments. H Xin, Y Tang, YH. Jin, Li HL, Tian Y, and C Yu performed experiments. Y.F. Pan, H. Xin, Y Tang, YH. Jin, Li HL, Tian Y, ZhaoZJ and Wu MS analyzed the data. YF Pan and H Xin prepared the manuscript.
Data availability statement
The data that support the findings of this study are available in The cBioPortal for Cancer Genomics [Kidney Renal Clear Cell Carcinoma (TCGA, Firehose Legacy)] at [https://www.cbioportal.org/study/summary?id=kirc_tcga] [52,53], and in OncoDB [Kidney Renal Clear Cell Carcinoma] at [https://oncodb.org/cgi-bin/genomic_normal_expression_search.cgi] [54].
References
- [1].Teyssonneau D, Gross-Goupil M, Domblides C, et al. Treatment of spinal metastases in renal cell carcinoma: a critical review. Crit Rev Oncol Hematol. 2018;125:19–29. doi: 10.1016/j.critrevonc.2018.02.017 [DOI] [PubMed] [Google Scholar]
- [2].Osorio FG, Navarro CL, Cadinanos J, et al. Splicing-directed therapy in a new mouse model of human accelerated aging. Sci Transl Med. 2011;3(106):106ra7. doi: 10.1126/scitranslmed.3002847 [DOI] [PubMed] [Google Scholar]
- [3].Tang Y, Jin YH, Li HL, et al. PBRM1 deficiency oncogenic addiction is associated with activated AKT-mTOR signalling and aerobic glycolysis in clear cell renal cell carcinoma cells. J Cell Mol Med. 2022;26:3837–3849. doi: 10.1111/jcmm.17418 [DOI] [PMC free article] [PubMed] [Google Scholar]
- [4].Gruenbaum Y, Medalia O.. Lamins: the structure and protein complexes. Curr Opin Cell Biol. 2015;32:7–12. doi: 10.1016/j.ceb.2014.09.009 [DOI] [PubMed] [Google Scholar]
- [5].Gruenbaum Y, Foisner R. Lamins: nuclear intermediate filament proteins with fundamental functions in nuclear mechanics and genome regulation. Annu Rev Biochem. 2015;84(1):131–164. doi: 10.1146/annurev-biochem-060614-034115 [DOI] [PubMed] [Google Scholar]
- [6].de Leeuw R, Gruenbaum Y, Medalia O. Nuclear lamins: thin filaments with major functions. Trends Cell Biol. 2018;28:34–45. doi: 10.1016/j.tcb.2017.08.004 [DOI] [PubMed] [Google Scholar]
- [7].Casasola A, Scalzo D, Nandakumar V, et al. Prelamin a processing, accumulation and distribution in normal cells and laminopathy disorders. Nucleus. 2016;7(1):84–102. doi: 10.1080/19491034.2016.1150397 [DOI] [PMC free article] [PubMed] [Google Scholar]
- [8].Tenga R, Medalia O. Structure and unique mechanical aspects of nuclear lamin filaments. Curr Opin Struct Biol. 2020;64:152–159. doi: 10.1016/j.sbi.2020.06.017 [DOI] [PubMed] [Google Scholar]
- [9].Kong L, Schafer G, Bu H, et al. Lamin A/C protein is overexpressed in tissue-invading prostate cancer and promotes prostate cancer cell growth, migration and invasion through the PI3K/AKT/PTEN pathway. Carcinogenesis. 2012;33(4):751–759. doi: 10.1093/carcin/bgs022 [DOI] [PubMed] [Google Scholar]
- [10].Liu H, Li D, Zhou L, et al. LMNA functions as an oncogene in hepatocellular carcinoma by regulating the proliferation and migration ability. J Cell Mol Med. 2020;24(20):12008–12019. doi: 10.1111/jcmm.15829 [DOI] [PMC free article] [PubMed] [Google Scholar]
- [11].Meaburn KJ, Misteli T. Assessment of the utility of gene positioning biomarkers in the stratification of prostate Cancers. Front Genet. 2019;10:1029. doi: 10.3389/fgene.2019.01029 [DOI] [PMC free article] [PubMed] [Google Scholar]
- [12].Saarinen I, Mirtti T, Seikkula H, et al. Differential predictive roles of A- and B-Type nuclear lamins in prostate cancer progression. PLoS One. 2015;10(10):e0140671. doi: 10.1371/journal.pone.0140671 [DOI] [PMC free article] [PubMed] [Google Scholar]
- [13].Kruck S, Eyrich C, Scharpf M, et al. Impact of an altered Wnt1/beta-catenin expression on clinicopathology and prognosis in clear cell renal cell carcinoma. Int J Mol Sci. 2013;14:10944–10957. doi: 10.3390/ijms140610944 [DOI] [PMC free article] [PubMed] [Google Scholar]
- [14].Wang Y, Elsherbiny A, Kessler L, et al. Lamin A/C-dependent chromatin architecture safeguards naive pluripotency to prevent aberrant cardiovascular cell fate and function. Nat Commun. 2022;13:6663. doi: 10.1038/s41467-022-34366-7 [DOI] [PMC free article] [PubMed] [Google Scholar]
- [15].Hodges C, Kirkland JG, Crabtree GR. The many roles of BAF (mSWI/SNF) and PBAF complexes in cancer. Cold Spring Harb Perspect Med. 2016;6(8):6. doi: 10.1101/cshperspect.a026930 [DOI] [PMC free article] [PubMed] [Google Scholar]
- [16].Nargund AM, Pham CG, Dong Y, et al. The SWI/SNF protein PBRM1 restrains VHL-Loss-driven clear cell renal cell carcinoma. Cell Rep. 2017;18(12):2893–2906. doi: 10.1016/j.celrep.2017.02.074 [DOI] [PMC free article] [PubMed] [Google Scholar]
- [17].Pan YF, Wansa KD, Liu MH, et al. Regulation of estrogen receptor-mediated long range transcription via evolutionarily conserved distal response elements. J Biol Chem. 2008;283(47):32977–32988. doi: 10.1074/jbc.M802024200 [DOI] [PubMed] [Google Scholar]
- [18].Eidet JR, Pasovic L, Maria R, et al. Objective assessment of changes in nuclear morphology and cell distribution following induction of apoptosis. Diagn Pathol. 2014;9(1):92. doi: 10.1186/1746-1596-9-92 [DOI] [PMC free article] [PubMed] [Google Scholar]
- [19].Sato Y, Yoshizato T, Shiraishi Y, et al. Integrated molecular analysis of clear-cell renal cell carcinoma. Nat Genet. 2013;45(8):860–867. doi: 10.1038/ng.2699 [DOI] [PubMed] [Google Scholar]
- [20].Hoadley KA, Yau C, Hinoue T, et al. Cell-of-origin patterns dominate the molecular classification of 10,000 tumors from 33 types of cancer. Cell. 2018;173:291–304 e6. doi: 10.1016/j.cell.2018.03.022 [DOI] [PMC free article] [PubMed] [Google Scholar]
- [21].Jeon T, Ko MJ, Seo YR, et al. Silencing CDCA8 suppresses hepatocellular carcinoma growth and stemness via restoration of ATF3 tumor suppressor and inactivation of AKT/β–catenin signaling. Cancers (Basel). 2021;13(5):1055. doi: 10.3390/cancers13051055 [DOI] [PMC free article] [PubMed] [Google Scholar]
- [22].Ma L, Zhang G, Miao XB, et al. Cancer stem-like cell properties are regulated by EGFR/AKT/beta-catenin signaling and preferentially inhibited by gefitinib in nasopharyngeal carcinoma. FEBS J. 2013;280:2027–2041. doi: 10.1111/febs.12226 [DOI] [PMC free article] [PubMed] [Google Scholar]
- [23].Kim BK, Cheong JH, Im JY, et al. PI3K/AKT/β-catenin signaling regulates vestigial-like 1 which predicts poor prognosis and enhances malignant phenotype in gastric cancer. Cancers (Basel). 2019;11(12):11. doi: 10.3390/cancers11121923 [DOI] [PMC free article] [PubMed] [Google Scholar]
- [24].Bank EM, Gruenbaum Y. Caenorhabditis elegans as a model system for studying the nuclear lamina and laminopathic diseases. Nucleus. 2011;2(5):350–357. doi: 10.4161/nucl.2.5.17838 [DOI] [PubMed] [Google Scholar]
- [25].Dubik N, Mai SLA. Lamin A/C: function in normal and tumor cells. Cancers (Basel). 2020;12(12):12. doi: 10.3390/cancers12123688 [DOI] [PMC free article] [PubMed] [Google Scholar]
- [26].Funkhouser CM, Sknepnek R, Shimi T, et al. Mechanical model of blebbing in nuclear lamin meshworks. Proc Natl Acad Sci U S A. 2013;110(9):3248–3253. doi: 10.1073/pnas.1300215110 [DOI] [PMC free article] [PubMed] [Google Scholar]
- [27].Tariq Z, Zhang H, Chia-Liu A, et al. Lamin a and microtubules collaborate to maintain nuclear morphology. Nucleus. 2017;8(4):433–446. doi: 10.1080/19491034.2017.1320460 [DOI] [PMC free article] [PubMed] [Google Scholar]
- [28].Rouhi L, Auguste G, Zhou Q, et al. Deletion of the lmna gene in fibroblasts causes senescence-associated dilated cardiomyopathy by activating the double-stranded DNA damage response and induction of senescence-associated secretory phenotype. J Cardiovasc Aging. 2022;2(3):30. doi: 10.20517/jca.2022.14 [DOI] [PMC free article] [PubMed] [Google Scholar]
- [29].Broers JL, Machiels BM, Kuijpers HJ, et al. A- and B-type lamins are differentially expressed in normal human tissues. Histochem Cell Biol. 1997;107:505–517. doi: 10.1007/s004180050138 [DOI] [PubMed] [Google Scholar]
- [30].Ivorra C, Kubicek M, Gonzalez JM, et al. A mechanism of AP-1 suppression through interaction of c-Fos with lamin A/C. Genes Dev. 2006;20(3):307–320. doi: 10.1101/gad.349506 [DOI] [PMC free article] [PubMed] [Google Scholar]
- [31].Maresca G, Natoli M, Nardella M, et al. LMNA knock-down affects differentiation and progression of human neuroblastoma cells. PLoS One. 2012;7(9):e45513. doi: 10.1371/journal.pone.0045513 [DOI] [PMC free article] [PubMed] [Google Scholar]
- [32].Guglielmi L, Nardella M, Musa C, et al. Lamin A/C is required for ChAT-Dependent neuroblastoma differentiation. Mol Neurobiol. 2017;54(5):3729–3744. doi: 10.1007/s12035-016-9902-6 [DOI] [PubMed] [Google Scholar]
- [33].Zhu Y, Yan L, Zhu W, et al. MMP2/3 promote the growth and migration of laryngeal squamous cell carcinoma via PI3K/Akt-NF-κB-mediated epithelial–mesenchymal transformation. J Cell Physiol. 2019;234(9):15847–15855. doi: 10.1002/jcp.28242 [DOI] [PubMed] [Google Scholar]
- [34].Thanomkitti K, Fong-Ngern K, Sueksakit K, et al. Molecular functional analyses revealed essential roles of HSP90 and lamin A/C in growth, migration, and self-aggregation of dermal papilla cells. Cell Death Discov. 2018;4:53. doi: 10.1038/s41420-018-0053-6 [DOI] [PMC free article] [PubMed] [Google Scholar]
- [35].Chen L, Jiang F, Qiao Y, et al. Nucleoskeletal stiffness regulates stem cell migration and differentiation through lamin A/C. J Cell Physiol. 2018;233(7):5112–5118. doi: 10.1002/jcp.26336 [DOI] [PubMed] [Google Scholar]
- [36].Lee JS, Hale CM, Panorchan P, et al. Nuclear lamin A/C deficiency induces defects in cell mechanics, polarization, and migration. Biophys J. 2007;93:2542–2552. doi: 10.1529/biophysj.106.102426 [DOI] [PMC free article] [PubMed] [Google Scholar]
- [37].Constantinescu D, Gray HL, Sammak PJ, et al. Lamin A/C expression is a marker of mouse and human embryonic stem cell differentiation. Stem Cells. 2006;24(1):177–185. doi: 10.1634/stemcells.2004-0159 [DOI] [PubMed] [Google Scholar]
- [38].Bermeo S, Vidal C, Zhou H, et al. Lamin A/C acts as an essential factor in mesenchymal stem cell differentiation through the regulation of the dynamics of the Wnt/beta-catenin pathway. J Cell Biochem. 2015;116:2344–2353. doi: 10.1002/jcb.25185 [DOI] [PubMed] [Google Scholar]
- [39].Zhang B, Yang Y, Keyimu R, et al. The role of lamin A/C in mesenchymal stem cell differentiation. J Physiol Biochem. 2019;75(1):11–18. doi: 10.1007/s13105-019-00661-z [DOI] [PubMed] [Google Scholar]
- [40].Frock RL, Kudlow BA, Evans AM, et al. Lamin A/C and emerin are critical for skeletal muscle satellite cell differentiation. Genes Dev. 2006;20(4):486–500. doi: 10.1101/gad.1364906 [DOI] [PMC free article] [PubMed] [Google Scholar]
- [41].Zhang X, Lv Y. Suspension state increases reattachment of breast cancer cells by up-regulating lamin A/C. Biochim Biophys Acta, Mol Cell Res. 2017;1864(12):2272–2282. doi: 10.1016/j.bbamcr.2017.09.006 [DOI] [PubMed] [Google Scholar]
- [42].Willis ND, Cox TR, Rahman-Casans SF, et al. Lamin A/C is a risk biomarker in colorectal cancer. PLoS One. 2008;3(8):e2988. doi: 10.1371/journal.pone.0002988 [DOI] [PMC free article] [PubMed] [Google Scholar]
- [43].Hong Y, Downey T, Eu KW, et al. A ‘metastasis-prone’ signature for early-stage mismatch-repair proficient sporadic colorectal cancer patients and its implications for possible therapeutics. Clin Exp Metastasis. 2010;27(2):83–90. doi: 10.1007/s10585-010-9305-4 [DOI] [PubMed] [Google Scholar]
- [44].Zhang ZY, Lu M, Liu ZK, et al. Rab11a regulates MMP2 expression by activating the PI3K/AKT pathway in human hepatocellular carcinoma cells. Pathol Res Pract. 2020;216(9):153046. doi: 10.1016/j.prp.2020.153046 [DOI] [PubMed] [Google Scholar]
- [45].Guo J, Jie W, Shen Z, et al. SCF increases cardiac stem cell migration through PI3K/AKT and MMP2/9 signaling. Int J Mol Med. 2014;34:112–118. doi: 10.3892/ijmm.2014.1773 [DOI] [PMC free article] [PubMed] [Google Scholar]
- [46].Tilgner K, Wojciechowicz K, Jahoda C, et al. Dynamic complexes of A-type lamins and emerin influence adipogenic capacity of the cell via nucleocytoplasmic distribution of beta-catenin. J Cell Sci. 2009;122:401–413. doi: 10.1242/jcs.026179 [DOI] [PMC free article] [PubMed] [Google Scholar]
- [47].Xu X, Zhang N, Gao R, et al. Upregulation of SDHA inhibited proliferation, migration, and invasion of clear cell renal cell carcinoma cells via inactivation of the Wnt/β-catenin pathway. J Recept Signal Transduction Res. 2022;2021(2):1–13. doi: 10.1080/10799893.2021.1883060 [DOI] [PubMed] [Google Scholar]
- [48].Bodnar L, Stec R, Cierniak S, et al. Role of WNT/beta-catenin pathway as potential prognostic and predictive factors in renal cell cancer patients treated with everolimus in the second and subsequent lines. Clin Genitourin Cancer. 2018;16:257–265. doi: 10.1016/j.clgc.2018.01.008 [DOI] [PubMed] [Google Scholar]
- [49].Inoki K, Ouyang H, Zhu T, et al. TSC2 integrates Wnt and energy signals via a coordinated phosphorylation by AMPK and GSK3 to regulate cell growth. Cell. 2006;126(5):955–968. doi: 10.1016/j.cell.2006.06.055 [DOI] [PubMed] [Google Scholar]
- [50].Cenni V, Bertacchini J, Beretti F, et al. Lamin a Ser404 is a nuclear target of Akt phosphorylation in C2C12 cells. J Proteome Res. 2008;7(11):4727–4735. doi: 10.1021/pr800262g [DOI] [PubMed] [Google Scholar]
- [51].Simon DN, Wilson KL. Partners and post-translational modifications of nuclear lamins. Chromosoma. 2013;122(1–2):13–31. doi: 10.1007/s00412-013-0399-8 [DOI] [PMC free article] [PubMed] [Google Scholar]
- [52].Cerami E, Gao J, Dogrusoz U, et al. The cBio cancer genomics portal: an open platform for exploring multidimensional cancer genomics data. Cancer Discov. 2012;2(5):401–404. doi: 10.1158/2159-8290.CD-12-0095 [DOI] [PMC free article] [PubMed] [Google Scholar]
- [53].Gao J, Aksoy BA, Dogrusoz U, et al. Integrative analysis of complex cancer genomics and clinical profiles using the cBioportal. Sci Signal. 2013;6(269):l1. doi: 10.1126/scisignal.2004088 [DOI] [PMC free article] [PubMed] [Google Scholar]
- [54].Tang G, Cho M, Wang X. OncoDB: an interactive online database for analysis of gene expression and viral infection in cancer. Nucleic Acids Res. 2022;50:D1334–D9. doi: 10.1093/nar/gkab970 [DOI] [PMC free article] [PubMed] [Google Scholar]
Associated Data
This section collects any data citations, data availability statements, or supplementary materials included in this article.
Data Availability Statement
The data that support the findings of this study are available in The cBioPortal for Cancer Genomics [Kidney Renal Clear Cell Carcinoma (TCGA, Firehose Legacy)] at [https://www.cbioportal.org/study/summary?id=kirc_tcga] [52,53], and in OncoDB [Kidney Renal Clear Cell Carcinoma] at [https://oncodb.org/cgi-bin/genomic_normal_expression_search.cgi] [54].


