This work was produced by Curry et al. under the terms of a commissioning contract issued by the Secretary of State for Health and Social Care. This is an Open Access publication distributed under the terms of the Creative Commons Attribution CC BY 4.0 licence, which permits unrestricted use, distribution, reproduction and adaptation in any medium and for any purpose provided that it is properly attributed. See: https://creativecommons.org/licenses/by/4.0/. For attribution the title, original author(s), the publication source – NIHR Journals Library, and the DOI of the publication must be cited.
NCBI Bookshelf. A service of the National Library of Medicine, National Institutes of Health.
Curry N, Davenport R, Thomas H, et al. Early high-dose cryoprecipitate to reduce mortality in adult patients with traumatic haemorrhage: the CRYOSTAT-2 RCT with cost-effectiveness analysis. Southampton (UK): National Institute for Health and Care Research; 2024 Nov. (Health Technology Assessment, No. 28.76.)
Early high-dose cryoprecipitate to reduce mortality in adult patients with traumatic haemorrhage: the CRYOSTAT-2 RCT with cost-effectiveness analysis.
Show detailsTABLE 17
Recruitment by study site
Baseline characteristics for different subgroups
TABLE 18
Baseline characteristics, by cryoprecipitate timing: data are number/total number (%) for categorical variables, and median (IQR) for continuous variables
| Standard care arm (n = 805) | Intervention arm | Overall (n = 1604) | |||||
|---|---|---|---|---|---|---|---|
| EC < 45 (n = 101) | EC 46–60 (n = 147) | EC 61–90 (n = 273) | EC ≥ 90 (n = 128) | EC unknown (n = 150) | |||
| Subjects | |||||||
| Male | 633/796 (80) | 81/101 (80) | 115/147 (78) | 218/273 (80) | 97/128 (76) | 107/136 (79) | 1251/1581 (79) |
| Age (years) | 40 (26–55) | 41 (28–52) | 34 (24–53) | 39 (26–55) | 37 (25–55) | 41 (27–58) | 39 (26–55) |
| Time from injury to admission to emergency department (minutes) | 77 (55–100) | 89 (69–107) | 76 (56–100) | 72 (52–96) | 70 (53–91) | 83 (60–104) | 76 (55–100) |
| Injuries and physiology at admission to emergency department | |||||||
| Blunt injury | 519/796 (65) | 60/101 (59) | 87/147 (59) | 174/273 (64) | 82/128 (64) | 92/136 (68) | 1014/1581 (64) |
| ISS | 29 (18–43) | 33 (17–43) | 29 (17–45) | 29 (17–43) | 29 (18–43) | 27 (16–42) | 29 (18–43) |
| Head AIS ≥ 4 | 191/664 (29) | 20/82 (24) | 32/132 (24) | 47/235 (20) | 24/111 (22) | 34/105 (32) | 348/1329 (26) |
| Systolic blood pressure (mmHg) | 103 (83–126) | 98 (78–121) | 104 (80–126) | 99 (84–122) | 104 (84–126) | 107 (92–130) | 103 (83–125) |
| Heart rate (per minute) | 108 (88–127) | 110 (91–130) | 110 (92–128) | 109 (86–128) | 108 (85–125) | 103 (85–121) | 108 (88–127) |
| In cardiac arrest | 17/735 (2) | 3/88 (3) | 2/132 (2) | 3/252 (1) | 2/122 (2) | 2/123 (2) | 29/1452 (2) |
| Glasgow Coma Scale score | 13 (3–15) | 3 (3–14) | 12 (3–14) | 14 (3–15) | 15 (7–15) | 12 (3–15) | 14 (3–15) |
| Pre hospital | |||||||
| RBC (units) | 0 (0–2) | 1 (0–2) | 0 (0–2) | 0 (0–1) | 0 (0–1) | 0 (0–1) | 0 (0–2) |
| FFP (units) | 0 (0–1) | 0 (0–2) | 0 (0–1) | 0 (0–1) | 0 (0–0) | 0 (0–1) | 0 (0–1) |
| Crystalloids (ml) | 0 (0–250) | 0 (0–300) | 0 (0–350) | 0 (0–250) | 0 (0–250) | 0 (0–300) | 0 (0–250) |
| Colloids (ml) | 0 (0–0) | 0 (0–0) | 0 (0–0) | 0 (0–0) | 0 (0–0) | 0 (0–0) | 0 (0–0) |
| TXA administered | 639/796 (80) | 86/100 (86) | 118/147 (80) | 209/272 (77) | 92/128 (72) | 110/136 (81) | 1254/1579 (79) |
EC, early cryoprecipitate; TXA, tranexamic acid.
Note
Summary of missing data: data on all characteristics were missing for 23 participants. In addition, ISS, cardiac arrest and blood pressure were missing for 246, 129 and 119 participants, respectively. There were a small number of missing data for other items.
TABLE 19
Baseline characteristics, by injury type: data are number/total number (%) for categorical variables, and median (IQR) for continuous variables
| Blunt | Penetrating | Overall (n = 1604) | |||
|---|---|---|---|---|---|
| Standard care arm (n = 519) | Intervention arm (n = 495) | Standard care arm (n = 277) | Intervention arm (n = 290) | ||
| Subjects | |||||
| Male | 384/519 (74) | 355/495 (72) | 249/277 (90) | 263/290 (91) | 1251/1581 (79) |
| Age (years) | 46 (30–60) | 46 (30–60) | 30 (22–43) | 30 (22–42) | 39 (26–55) |
| Time from injury to admission to emergency department (minutes) | 88 (67–108) | 84 (66–106) | 57 (44–78) | 59 (41–83) | 76 (55–100) |
| Injuries and physiology at admission to emergency department | |||||
| Blunt injury | 519/519 (100) | 495/495 (100) | 0/277 (0) | 0/290 (0) | 1014/1581 (64) |
| ISS | 38 (27–50) | 36 (26–48) | 18 (11–26) | 17 (10–26) | 29 (18–43) |
| Head AIS ≥ 4 | 176/453 (39) | 143/437 (33) | 15/211 (7) | 14/228 (6) | 348/1329 (26) |
| Systolic blood pressure (mmHg) | 104 (82–128) | 100 (84–125) | 102 (84–126) | 104 (84–124) | 103 (83–125) |
| Heart rate (per minute) | 107 (88–126) | 108 (89–126) | 109 (87–129) | 107 (87–128) | 108 (88–127) |
| In cardiac arrest | 9/479 (2) | 7/453 (2) | 8/256 (3) | 5/264 (2) | 29/1452 (2) |
| Glasgow Coma Scale score | 6 (3–15) | 12 (3–15) | 15 (11–15) | 14 (8–15) | 14 (3–15) |
| Pre hospital | |||||
| RBC (units) | 0 (0–2) | 0 (0–2) | 0 (0–1) | 0 (0–1) | 0 (0–2) |
| FFP (units) | 0 (0–1) | 0 (0–1) | 0 (0–1) | 0 (0–1) | 0 (0–1) |
| Crystalloids (ml) | 0 (0–250) | 0 (0–300) | 0 (0–100) | 0 (0–100) | 0 (0–250) |
| Colloids (ml) | 0 (0–0) | 0 (0–0) | 0 (0–0) | 0 (0–0) | 0 (0–0) |
| TXA administered | 439/519 (85) | 406/495 (82) | 200/277 (72) | 209/288 (73) | 1254/1579 (79) |
TXA, tranexamic acid.
Note
Summary of missing data: data on all characteristics were missing for 23 participants. In addition, ISS, cardiac arrest and blood pressure were missing for 246, 129 and 119 participants, respectively. There were a small number of missing data for other items.
Sensitivity analyses
TABLE 20
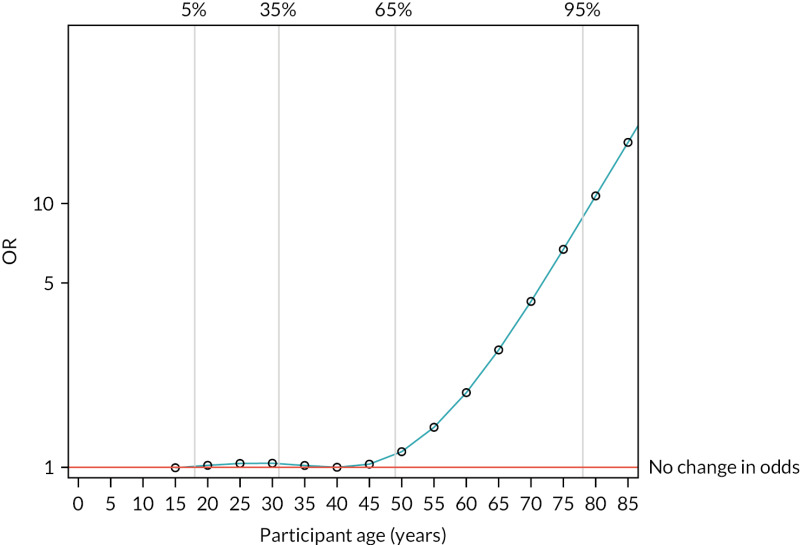
Risk-adjusted multivariable marginal model for all-cause mortality at 28 days
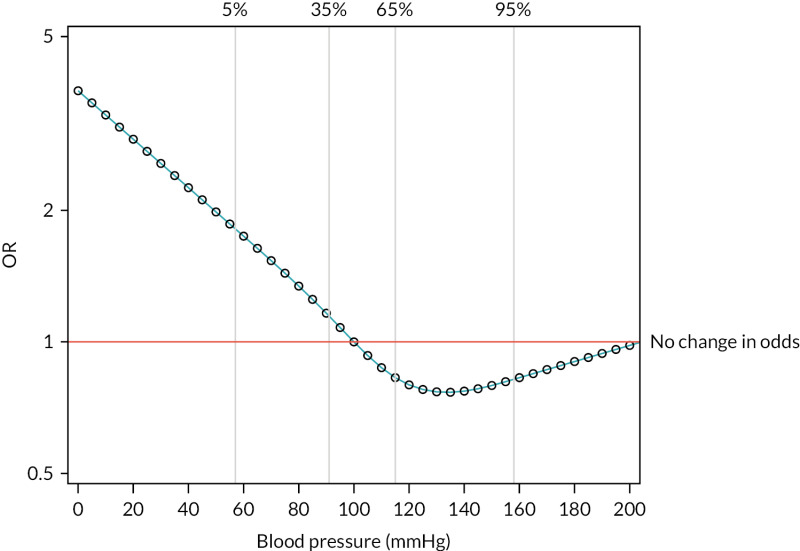
FIGURE 13
Risk-adjusted OR by systolic blood pressure, relative to a baseline participant with systolic blood pressure of 100 mmHg.
TABLE 21
Exclusions from per-protocol cohort, by treatment arm: n/N (%)
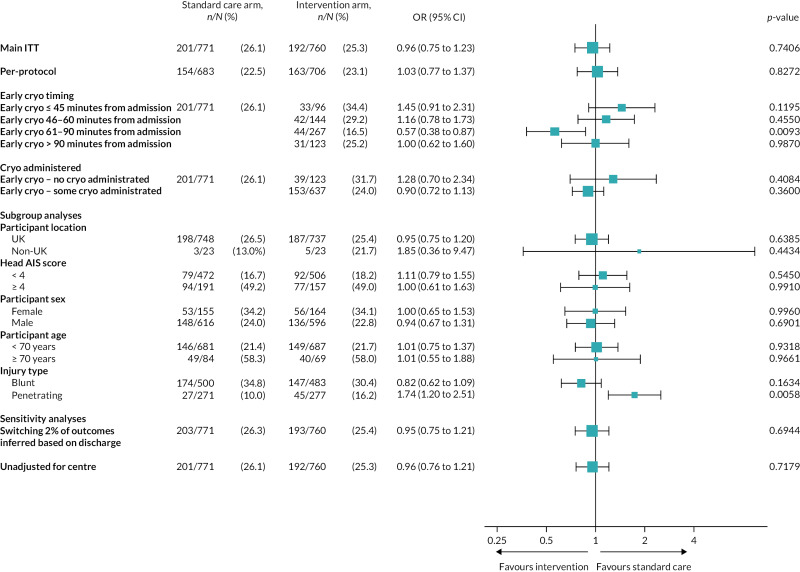
FIGURE 14
Forest plot of ORs and CIs for main ITT and per-protocol analyses of the primary outcome, subgroup analyses and sensitivity analyses.
TABLE 22
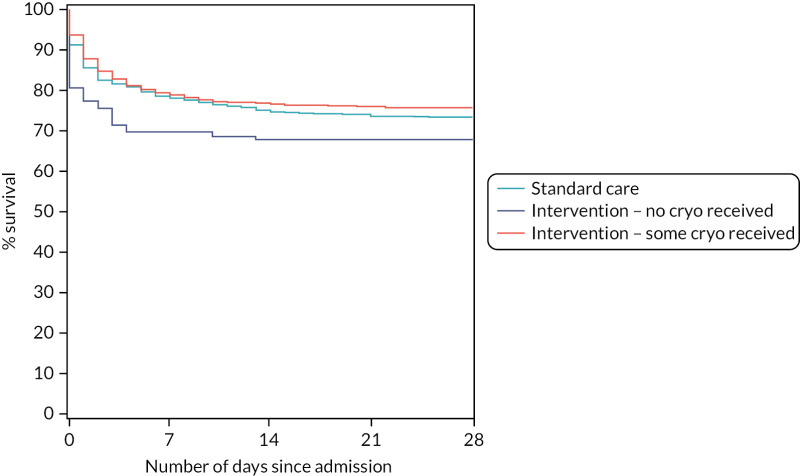
All-cause mortality at 28 days in the standard care arm and the intervention arm for those who did or did not receive any cryoprecipitate
Subgroup analyses
TABLE 23
All-cause mortality at 28 days by treatment arm: UK participants vs. US participants
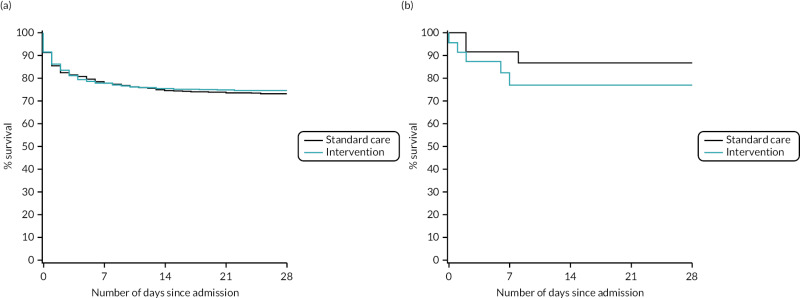
FIGURE 16
Kaplan–Meier survival plots up to 28 days from admission by treatment arm for (a) UK and (b) USA.
TABLE 24
All-cause mortality at 28 days by treatment arm: head AIS < 4 vs. head AIS ≥ 4
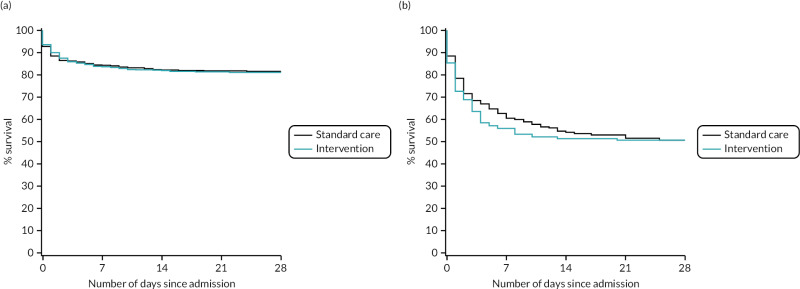
FIGURE 17
Kaplan–Meier survival plots up to 28 days from admission by treatment arm for (a) head AIS < 4 and (b) head AIS ≥ 4.
TABLE 25
All-cause mortality at 28 days by treatment arm: participant sex
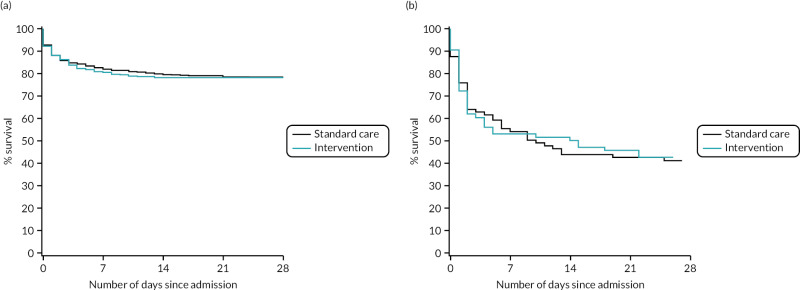
FIGURE 18
Kaplan–Meier survival plots up to 28 days from admission by treatment arm for (a) male and (b) female patients.
TABLE 26
All-cause mortality at 28 days by treatment arm: participant age < 70 vs. ≥ 70 years
Secondary outcomes
TABLE 27
Mortality data
TABLE 28
Transfusion requirements
FIGURE 20
Box-and-whisker plots to summarise transfusions administered from injury up to 24 hours from admission, by treatment arm. (a) RBC; (b) platelets; (c) FFP; (d) cryoprecipitate; (e) total blood products; and (f) crystalloids. These box-and-whisker plots show the median (line inside box), IQR (boundary of box), mean (diamond), minimum and maximum (whiskers) and outliers (values 1.5 × IQR above Q3 or below Q1). Extreme outliers for all products, defined as the top 1% of data, were excluded from these plots. Note the differing y-axes for each product.
TABLE 29
Quality of life at discharge and 6 months after admission
TABLE 30
Hospital stay
TABLE 31
All-cause mortality at 6 and 12 months by treatment arm
- Additional tables and figures - Early high-dose cryoprecipitate to reduce mortal...Additional tables and figures - Early high-dose cryoprecipitate to reduce mortality in adult patients with traumatic haemorrhage: the CRYOSTAT-2 RCT with cost-effectiveness analysis
Your browsing activity is empty.
Activity recording is turned off.
See more...
