NCBI Bookshelf. A service of the National Library of Medicine, National Institutes of Health.
Karanikolos M, Adib K, Azzopardi Muscat Net al., authors; Figueras J, Karanikolos M, Guanais F, et al., editors. Assessing health system performance: Proof of concept for a HSPA dashboard of key indicators [Internet]. Copenhagen (Denmark): European Observatory on Health Systems and Policies; 2023. (Policy Brief, No. 60.)
Access to and quality of health services are two important dimensions of health service delivery. Access ensures that individuals can readily obtain the healthcare services they need, regardless of their geographical location, financial status, or social/cultural background. Quality, on the other hand, focuses on the standards of healthcare services, their effectiveness, safety, and user experience. Accessing low-quality health services would bring little benefit and high-quality health services are of little use when people cannot access them. All countries are facing challenges in both of these dimensions and there is large variability in accessibility and quality across and within countries.
Assessing health service delivery is a complex task owing to various possible approaches (Papanicolas et al., 2022), and high-level tracer indicators generally serve as a starting point in its measurement. Access and quality feature prominently as central domains of performance assessments in both WHO-Observatory and OECD’s HSPA frameworks. Yet healthcare services can also be assessed through the different types of care, such as primary care, specialist care, long-term care, mental health care, etc., and whether and how well services are coordinated and/or integrated. Ultimately, the accessibility and quality of healthcare services contribute to achieving the overarching health system goal of health improvement, as well as equity.
This section focuses on showcasing the use of tracer indicators for assessing access and one specific dimension of quality – effectiveness. While high-quality care requires health services to be safe, appropriate, clinically effective, and responsive to patient needs, the attention in this section is narrowed to one high-level indicator of healthcare effectiveness. Due to the limited scope of this section, a more extensive but targeted set of performance indicators on effectiveness is not explored here (see Section 5.3). However, OECD has been reporting healthcare quality and outcome (HCQO) indicators for the last two decades and the 2023 HCQO indicator set includes 84 unique indicators, designed to assess the quality of primary care, acute care, integrated care, mental health care, patient experiences, patient safety, end of life care, and cancer care (OECD, 2023a).
This section addresses the following policy questions to illustrate the possible use of high-level indicators:
- Are health services sufficiently accessible?
- Are health services effective?
5.1. Policy question: Are health services sufficiently accessible?
The principle of UHC implies access to high-quality care for the whole population, irrespective of their socioeconomic circumstances. Yet access can be limited for several reasons, including limited availability or affordability of services. People often experience barriers, including financial, physical, geographical, administrative, and cultural. Accessibility of health services is also conditioned by other health system functions and characteristics, such as governance, expenditure and financing, and the workforce and digitalization as mentioned in previous chapters. These resources and characteristics determine which health services are available, where and for whom, and how much financial and human resources are devoted to different types of care.
In a well performing health system, health services need to be accessible to all those in need of them. Access in this regard refers to the extent to which health services are available and accessible in a timely manner. The high-level indicator that provides a starting point for assessing access to healthcare services is:
- Unmet healthcare needs
Unmet healthcare needs
The unmet healthcare needs indicator shows the share of people who reported that there was at least one occasion in the previous 12 months where they felt they needed healthcare but were not able to access it. Presence of unmet healthcare need is reported alongside the reason for not being able to access healthcare, such as cost, travel distance, and waiting time. Unmet healthcare need is widely used to capture barriers to accessing healthcare from the people’s perspective and has been shown to have validity as a proxy measure for access to health services (Gibson et al., 2019).
The unmet healthcare need indicator is derived from population surveys. In the EU/EEA countries the question on unmet healthcare and dental care need is included in the annual EU Statistics on Income and Living Conditions (EU-SILC) survey. In addition, the European Health Interview Survey (EHIS) includes a question on unmet healthcare need that provides more detailed breakdown by service type (mental health care and prescribed medicines, in addition to medical and dental care).
Beyond assessing access broadly, the unmet healthcare need indicator provides insight into equity of service delivery. Data obtained from population surveys usually allow breakdowns by income, education, employment status, and geographical region, in addition to the usual demographic strata. It is one of the few system-wide indicators routinely available in EU and some other countries that sheds light on the degree of equity in health service delivery.
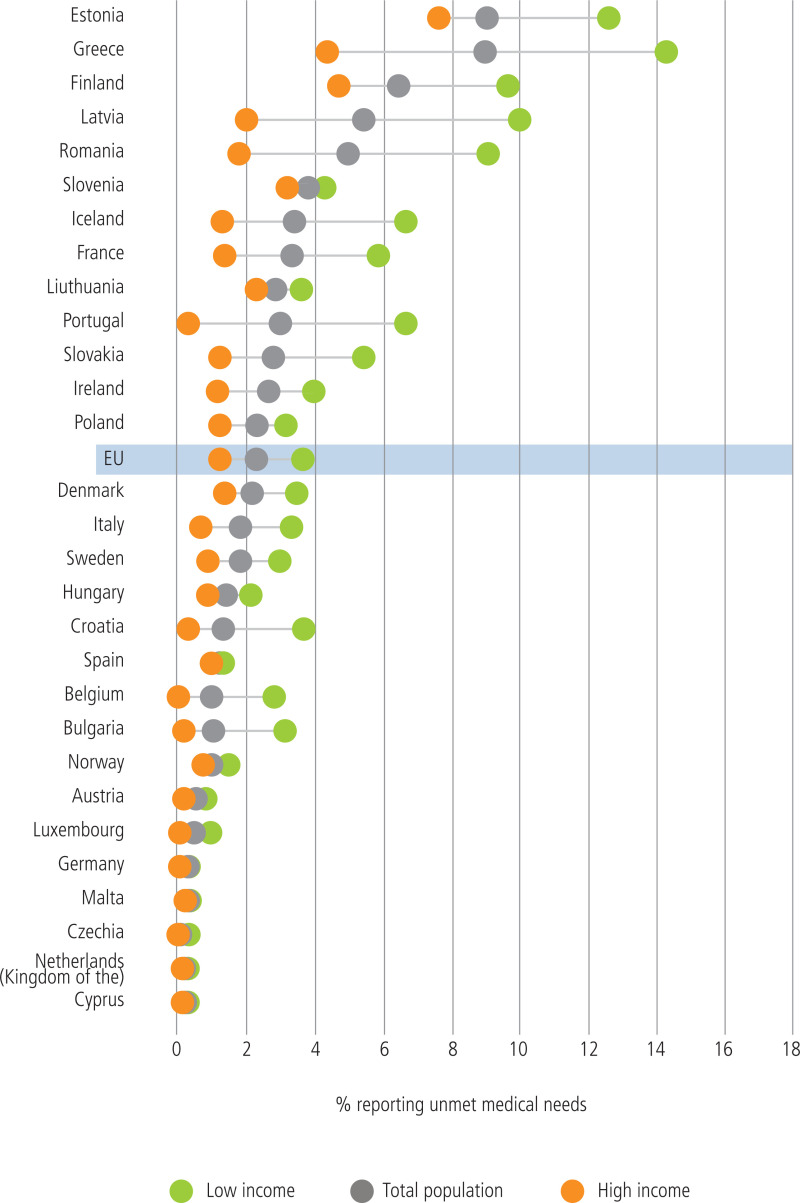
Fig. 5.1 shows the levels of unmet healthcare needs due to cost, travel distance, or waiting time by income quintile in EU/EEA countries in 2022 (subset for medical care). In some countries, there is a substantial share of people who experience barriers in accessing care, and in almost all EU/EEA countries there is scope for improving equity, as people in the lowest income quintile often experience much higher levels of unmet healthcare needs.
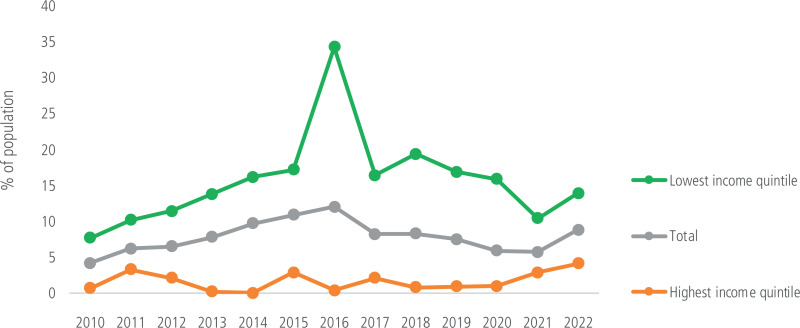
Fig. 5.2 shows the change over time in unmet healthcare needs in Greece by income quintile. In the aftermath of the economic crisis and subsequent introduction of austerity measures, Greece experienced a rise in unemployment and a loss of healthcare coverage among unemployed people. This led to unmet healthcare needs peaking at 34% for people in the lowest income quintile in 2016. At the end of that year separate funding was allocated to cover unemployed people, allowing them access to publicly financed services and thus reducing unmet needs (OECD/European Observatory, 2019).
Limitations and challenges of interpreting this indicator
The main limitation of this indicator is that it is self-reported and self-assessed and may not necessarily reflect real unmet needs (Gibson et al., 2019). Another challenge is the comparison across countries, as cultural factors affect perception of unmet needs. Further, there is some variation in the survey questions across countries, even when methodology is harmonized. There is also ambiguity with regard to the attribution of reasons for unmet needs – for example, identifying cost versus waiting time may not always be clear. Finally, interpretation of unmet healthcare needs in 2020–2021 is complex as a result of the impact of the COVID-19 pandemic on health services, which also affected people’s perceptions and healthcare-seeking behaviour.
Eurostat reports unmet healthcare needs from both the EU-SILC and EHIS surveys, and caution needs to be used in the interpretation of these data and their use for comparison, particularly as the former shows share of total population, while the latter only looks at various breakdowns within people who reported presence of unmet healthcare need.
How can the indicator help monitor and transform the accessibility of health services?
The indicator of unmet healthcare needs provides information on equity of health service delivery through exploring barriers to accessing healthcare. The breakdown of the reasons for unmet healthcare needs into cost, waiting time, and distance provides information on service availability in terms of geographical distribution (when time to travel presents a significant barrier), healthcare service capacity (when waiting time presents the main barrier), and healthcare coverage (in case of unmet needs due to costs).
5.2. Policy question: Are health services effective?
In both HSPA frameworks, effectiveness of healthcare delivery is part of the broader domain of quality of care. High-quality care requires that service is not only effective, but also safe for patients, appropriate, and responds to patient needs. When focusing on effectiveness only, it is possible to assess it for different types of healthcare (or for selected interventions), or by looking at levels of coordination or coverage of target population. We can measure the effectiveness of preventive care and primary care, as well as secondary care, using for instance the dedicated set of OECD HCQO indicators (OECD, 2023a). At a more general level, a high-level indicator for effectiveness of healthcare services as a whole that focuses on the extent to which health services achieve the desired outcomes is:
- Avoidable mortality
Avoidable mortality
Avoidable mortality indicators provide a starting point to assess the performance of public health and healthcare policies in avoiding premature mortality from preventable and treatable causes of death.
Avoidable mortality is an established, yet evolving concept and it comprises deaths from causes where mechanisms should have been in place to prevent certain health conditions from developing, and if these health conditions do develop, timely and effective care could avoid premature deaths. While there are more concepts to explore relating to avoidable mortality, building on earlier works of Nolte & McKee (2004, 2011), Eurostat and OECD have worked together to develop a revised list of causes of mortality and the age limits, using the following definitions of preventable and treatable causes of mortality (OECD/Eurostat, 2022):
- Preventable mortality: Causes of death that can be mainly avoided through effective public health and primary prevention interventions (i.e., before the onset of diseases/injuries, to reduce incidence);
- Treatable2 mortality: Causes of death that can be mainly avoided through timely and effective healthcare interventions, including secondary prevention and treatment (i.e., after the onset of diseases, to reduce case-fatality).
The OECD/Eurostat avoidable mortality list reflects current health expectations, medical technology and knowledge, and developments in health policy, and hence is subject to revisions. It was published in 2018 and the last revision took place in 2022; the latter included COVID-19 among causes of preventable mortality (OECD/Eurostat, 2022).
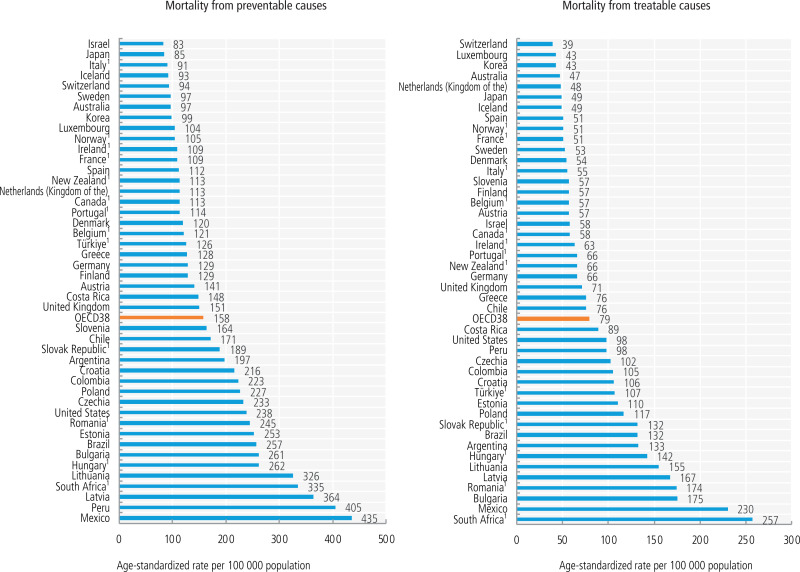
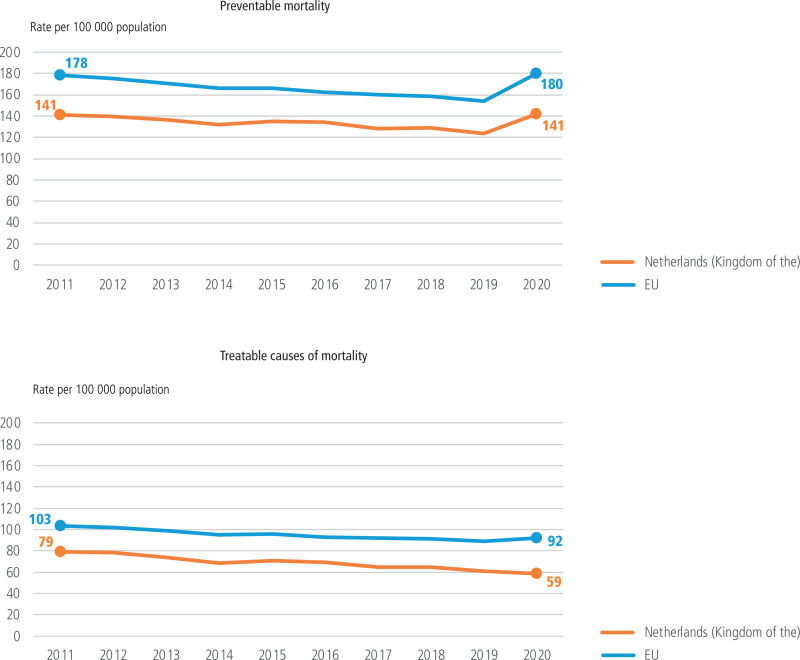
Figures 5.3 and 5.4 below illustrate the use of preventable and treatable mortality indicators as displayed in the OECD’s Health at a Glance and in the OECD/European Observatory’s State of Health in the EU country health profiles. A cross-country picture (Fig. 5.3) suggests a more than five-fold difference in preventable and treatable mortalities across countries with available data in 2021. This shows that in many countries, major improvements in the effectiveness and timeliness of healthcare are needed to reduce premature avoidable deaths. Fig. 5.4 shows an example of avoidable mortality rates in Netherlands (Kingdom of the) over time. While the rates are relatively low and have been largely reducing between 2010 and 2020, the COVID-19 pandemic prompted an increase in preventable deaths in 2020, as COVID-19 was then included in the list of preventable deaths. At the same time, treatable mortality remained low, suggesting that at least in 2020 access to and quality of healthcare services in Netherlands (Kingdom of the) did not deteriorate because of the pandemic.
Limitations and challenges of interpreting this indicator
Key limitations in using avoidable mortality as an indicator of effectiveness of healthcare services is that it is not a precise measure, as access to and overall quality of healthcare services also have an influence. Nevertheless, high levels of avoidable mortality suggest that effectiveness of healthcare in those countries may be sub-optimal.
Avoidable mortality is recognized globally as a key indicator of effectiveness of preventive and curative health services. More than one list of avoidable mortality exists, however. Avoidable mortality is technically defined through a list of causes that are considered to be preventable or treatable. These lists, as well as age limits, can and do vary, and they evolve through time (see Rutstein et al., 1976; Nolte & McKee, 2004; Hoffmann et al., 2013; OECD/Eurostat, 2022). Avoidable mortality indicators also rely on high-quality vital statistics for cause of death registration. Standardized preventable and treatable mortality are routinely calculated by Eurostat and OECD, as shown in Figures 5.3 and 5.4. The Institute for Health Metrics and Evaluation used estimates of amenable mortality for calculation of the Health Access and Quality Index globally (Fullman et al., 2018), and the WHO Global mortality database (WHO, 2023) contains data that allow standardized avoidable mortality rates for many countries to be calculated by selecting causes according to a chosen list.
Other limitations in interpreting avoidable mortality indicators involve more technical aspects. Restricting deaths to typically those under 75 years is done because in older age groups attribution to one specific cause of death becomes increasingly difficult, especially with growing multimorbidity. In countries where avoidable mortality is low, there is less potential for improvement, and therefore policy implications become less clear. Finally, measuring mortality only focuses on fatal cases, while the burden of non-fatal conditions remains unaccounted for.
While avoidable mortality is an aggregated indicator, it can be broken down further to understand which causes of death contribute to high rates (or an increase) of avoidable mortality, helping to identify where policy attention is warranted. For example, deaths from lung cancer and alcohol-related deaths are considered preventable through tobacco and alcohol control policies, while road traffic deaths are driven by poor road safety measures (Nolte & McKee, 2004). Premature deaths from many chronic conditions, including ischaemic heart disease, stroke, diabetes and COPD, reflect weaknesses in both prevention (which should help averting conditions from developing) and treatment (where lack of access to services, inadequate chronic disease management in primary care and lack of or poor-quality specialist care lead to deaths). More granular data (for example, by region or socioeconomic status) can provide further information about the equity of the health system, and provide information on the accessibility of health services.
How can the indicator help monitor and transform the effectiveness of health services?
The measure of avoidable mortality provides a bird’s-eye view on the overall performance of a health system and signals whether the preventive and curative health services achieve the desired outcome in avoiding premature deaths.
A tailored set of healthcare quality and outcome indicators can provide further insight into the safety and effectiveness of preventive, primary, and secondary care, as well as into care coordination and integration and patients’ experience. For instance, avoidable hospital admissions is an indicator that measures the effectiveness of primary care for chronic conditions. Cancer screening rates is an indicator for targeting preventive care, and cancer survival rates together with 30-day mortality following acute conditions such as myocardial infarction and stroke provide information on the effectiveness of secondary care (OECD, 2023a).
5.3. Looking to the future
As this section has illustrated, there is considerable variability in accessibility and healthcare quality across and within (for unmet healthcare need by income quintile) countries. However, to assess access to and the overall quality of health services, and to be able to understand and address the underlying issues, multiple dimensions need to be considered. Ideally, access and quality of healthcare should be considered in interaction, as focusing on only one of them may lead to overlooking where the main challenges lie.
This section reviewed two specific high-level tracer indicators – unmet healthcare needs and avoidable mortality – to explore policy questions of to what extent healthcare services are accessible and of high quality. This by no means does justice to the complexity of health service delivery and the importance of addressing the performance of specific types of health services, such as public health, primary care, specialist care, long-term care, mental health care, etc. These can be explored and assessed through specific metrics, such as the OECD healthcare quality and outcome indicators set reported in the OECD’s Health at a Glance (OECD, 2023b). However, the key utility of the chosen indicators in this section is their role as system-level metrics, for which high values flag up that systemic issues in healthcare provision may exist.
Despite the importance of both indicators, good-quality data needed for their reliability are rarely available beyond most EU and OECD countries. It is important to ensure that high-quality mortality registration exists and population surveys contain health-related questions, including on unmet healthcare need, and are carried out on a regular basis with the data made available for research.
The scope of this brief does not allow for examining other key existing indicators that are being used routinely to assess quality, including a closer look at effectiveness, safety, and patient experience. The future expansion of this work could focus on better understanding the strengths and weaknesses of such indicators and finding innovative ways of linking them empirically to other features of the health system.
References
- Fullman N, et al. Measuring performance on the Healthcare Access and Quality Index for 195 countries and territories and selected subnational locations: a systematic analysis from the Global Burden of Disease Study 2016. Lancet. 2018;391(10136):2236–71. Available at: https://www
.thelancet .com/journals/lancet /article/PIIS0140-6736(18)30994-2 /fulltext (accessed 7 December 2023) [PMC free article: PMC5986687] [PubMed: 29893224] - Gibson G, Grignon M, Hurley J, Wang L. Here comes the SUN: Self-assessed unmet need, worsening health outcomes, and health care inequity. Health Econ. 2019;28(6):727–35. [PubMed: 31020778]
- Hoffmann R, Plug I, Khoshaba B, McKee M, MacKenbach JP., Amiehs Working group. Amenable mortality revisited: the AMIEHS study. Gaceta sanitaria, SESPAS. 2013;27(3):199–206. [PubMed: 23207428]
- Nolte E, McKee M. Does health care save lives? Avoidable mortality revisited. London: Nuffield Trust; 2004. Available at: https://www
.nuffieldtrust .org.uk/sites/default /files/2017-01 /does-healthcare-save-lives-web-final .pdf (accessed 7 December 2023) - Nolte E, McKee M. Variations in amenable mortality–trends in 16 high-income nations. Health Policy. 2011;103(1):47–52. [PubMed: 21917350] [CrossRef]
- OECD/European Observatory. Greece: country health profile. Luxembourg: European Commission; 2019. Available at: Luxembourg https://health
.ec.europa .eu/system/files /2019-11/2019_chp_gr_english_0.pdf (accessed 18 December 2023) - OECD/European Observatory. State of Health in the EU: country health profiles. Luxembourg: 2023. Available at: https://health
.ec.europa .eu/state-health-eu /country-health-profiles _en#country-health-profiles-2023 (accessed 18 December 2023) - OECD. OECD Health Statistics 2023. Paris: OECD Publishing; 2023a. Available at: https://www
.oecd.org/health/health-data .htm (accessed 7 December 2023) - OECD. Health at a Glance 2023. Paris: OECD Publishing; 2023b. Available at: https://www
.oecd.org /health/health-at-a-glance/ (accessed 7 December 2023) - OECD/European Observatory on health systems and policies. State of Health in the EU: Country health profiles. 2023. Available at: https://health
.ec.europa .eu/state-health-eu /country-health-profiles_en (accessed 7 December 2023) - OECD/Eurostat. Avoidable mortality: OECD/Eurostat lists of preventable and treatable causes of death (January 2022 version). Paris: OECD Publishing; 2022. Available at: https://www
.oecd.org /health/health-systems /Avoidable-mortality-2019-Joint-OECD-Eurostat-List-preventable-treatable-causes-of-death.pdf (accessed 7 December 2023) - Papanicolas I, Rajan D, Karanikolos M, Soucat A, Figueras J. Health system performance assessment: a framework for policy analysis. Copenhagen: WHO Regional Office for Europe on behallf of the European Observatory on Health Systems and Policies); 2022. Available at: https:
//eurohealthobservatory .who.int/publications /i/health-system-performance-assessment-a-framework-for-policy-analysis (accessed 7 December 2023) [PubMed: 37023239] - Rutstein DD, Berenberg W, Chalmers TC, Child CG 3rd, Fishman AP, Perrin EB. Measuring the quality of medical care. A clinical method. N Engl J Med. 1976;294(11):582–8. [PubMed: 942758]
- WHO. WHO Global mortality database. 2023. https://www
.who.int/data /data-collection-tools /who-mortality-database .
Footnotes
- 2
The label “amenable” mortality was used in previous Eurostat lists. This was changed to “treatable” in the OECD/Eurostat list (2022) to make more explicit the link with healthcare interventions. Amenable mortality remains in use in parallel with the OECD/Eurostat list.
Figures
Figure 5.1Self-reported unmet medical care needs owing to cost, travel distance, or waiting time, by income quintile, 2022
Source: OECD/European Observatory, 2023
Figure 5.3Preventable and treatable mortality rates in OECD countries, 2021 or latest available
Note: 1.Most recent data point corresponds to 2016-2019.
Source: OECD, 2023b, https://stat.link/gvxat7
Figure 5.4Preventable and treatable mortality rates in Netherlands (Kingdom of the) and the EU, 2011-2020
Source: OECD/European Observatory, State of Health in the EU Profiles, 2023.


