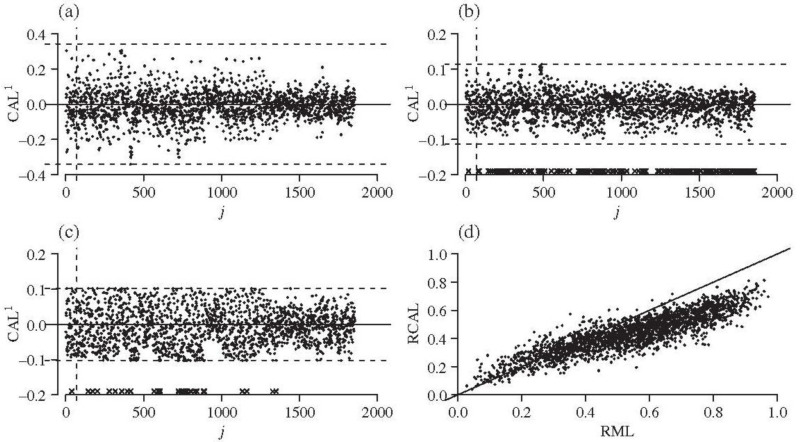
Figure 1. Standardized Calibration Differences CAL1(π^;fj) Plotted Against Index j for the Estimators (a) π^=E(T), (b) π^RML, and (c) π^RCAL1 With λ Selected by Cross-Validation.

Figure 1Standardized Calibration Differences CAL1(π^;fj) Plotted Against Index j for the Estimators (a) π^=E(T), (b) π^RML, and (c) π^RCAL1 With λ Selected by Cross-Validationa

aIn each panel, a vertical line is placed at the end of the indices for 71 main effects, and 2 horizontal lines are placed at the maximum absolute standardized differences; crosses (x) mark the indices j corresponding to 188 nonzero estimates of γj for π^RML and 32 nonzero estimates of γj for π^RCAL1. (d) Fitted PSs π^RML (Xi), π^RCAL1 (Xi) in the treated sample {i: Ti = 1, i = 1,…, n}.

From: Developing and Testing New Methods for Estimating Treatment Effectiveness in Observational Studies Using High-Dimension Data

Cover of Developing and Testing New Methods for Estimating Treatment Effectiveness in Observational Studies Using High-Dimension Data
Developing and Testing New Methods for Estimating Treatment Effectiveness in Observational Studies Using High-Dimension Data [Internet].
Tan Z, Gerhard T, Sun B.
Copyright © 2022. Rutgers, The State University of New Jersey. All Rights Reserved.

This book is distributed under the terms of the Creative Commons Attribution-NonCommercial-NoDerivs License which permits noncommercial use and distribution provided the original author(s) and source are credited. (See https://creativecommons.org/licenses/by-nc-nd/4.0/

NCBI Bookshelf. A service of the National Library of Medicine, National Institutes of Health.