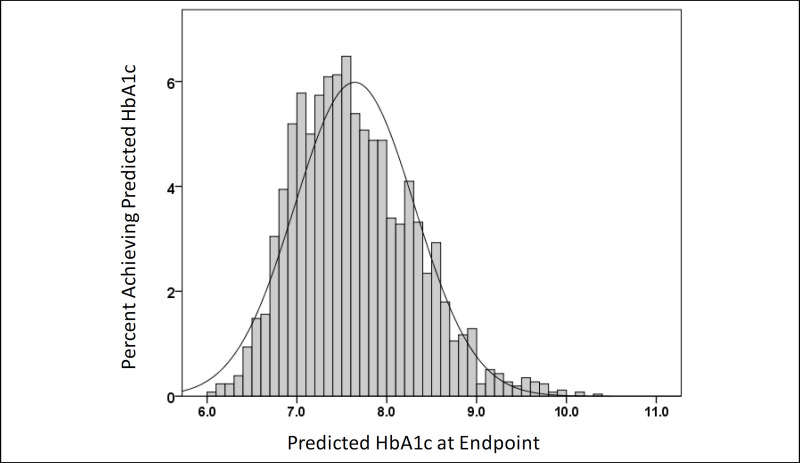
Figure 4. Distribution of Estimated Values of HbA1c End Point From Regression After Adjusting for Age, Baseline HbA1c, Assigned Treatment, SAT Perceived Effectiveness, and SES Distress Subscales.

Figure 4Distribution of Estimated Values of HbA1c End Point From Regression After Adjusting for Age, Baseline HbA1c, Assigned Treatment, SAT Perceived Effectiveness, and SES Distress Subscalesa

Abbreviations: HbA1c; hemoglobin A1c; SAT, treatment satisfaction; SES, side effects and symptoms.

aOverall mean, 7.64%; SD, 0.67%; N = 2562.

From: Benchmarking the Comparative Effectiveness of Diabetes Treatments Using Patient-Reported Outcomes and Socio-Demographic Factors

Cover of Benchmarking the Comparative Effectiveness of Diabetes Treatments Using Patient-Reported Outcomes and Socio-Demographic Factors
Benchmarking the Comparative Effectiveness of Diabetes Treatments Using Patient-Reported Outcomes and Socio-Demographic Factors [Internet].
Testa MA, Su M, Turchin A, et al.
Copyright © 2021. Harvard T.H. Chan School of Public Health. All Rights Reserved.

This book is distributed under the terms of the Creative Commons Attribution-NonCommercial-NoDerivs License which permits noncommercial use and distribution provided the original author(s) and source are credited. (See https://creativecommons.org/licenses/by-nc-nd/4.0/

NCBI Bookshelf. A service of the National Library of Medicine, National Institutes of Health.