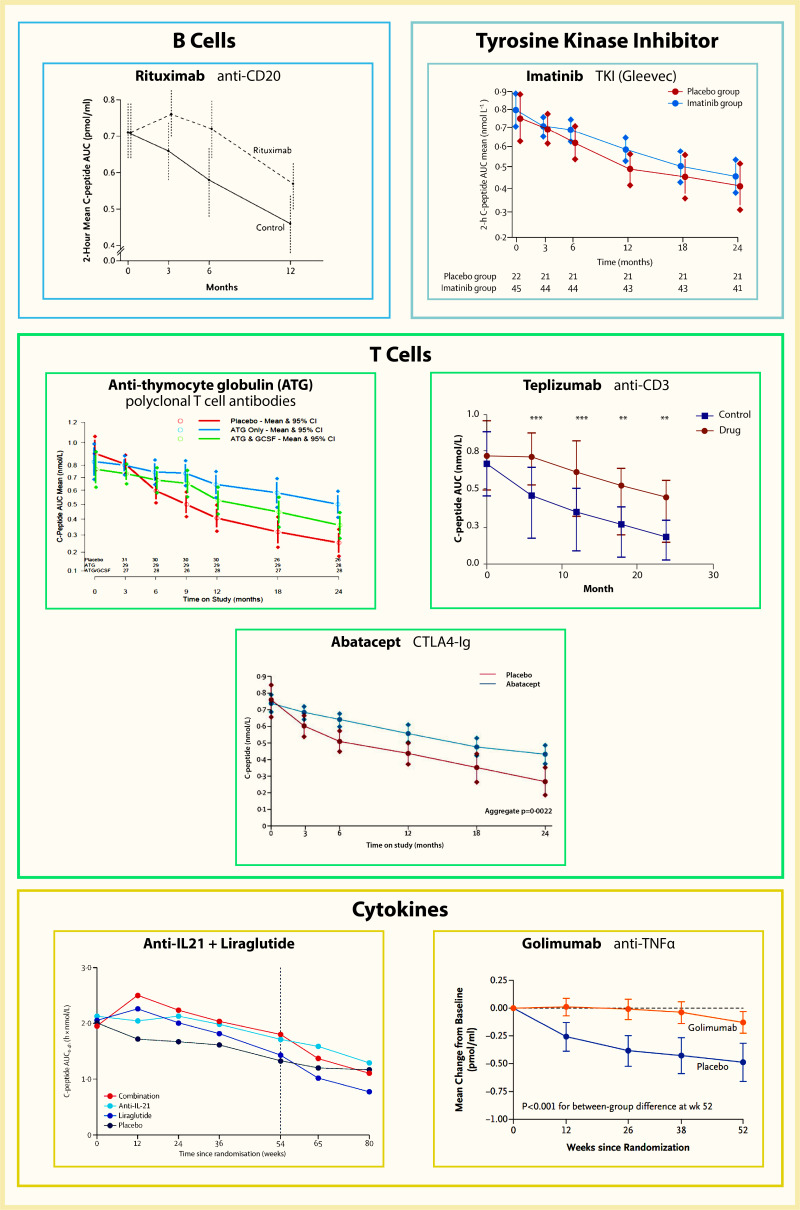
Area under the curve plots showing beta cell loss for seven randomized trials, grouped by therapeutic target. For each study, the treatment group had greater C-peptide retention compared to the control group.

FIGURE 3.

Visual Depiction of Seven New-Onset Type 1 Diabetes Randomized Clinical Trial Primary Endpoint Results (Area Under the Curve C-peptide).

The therapeutic target for each drug is indicated above each set of graphs. ATG, anti-thymocyte globulin; AUC, area under the curve; CI, confidence interval; CTLA4, cytotoxic T lymphocyte-associated antigen 4; GCSF, granulocyte colony-stimulating factor; IL-21, interleukin 21; TNF, tumor necrosis factor.

SOURCE: References (132,139,142,147,166,174,175)

From: Prevention of Type 1 Diabetes

Cover of Diabetes in America
Diabetes in America [Internet].
Lawrence JM, Casagrande SS, Herman WH, et al., editors.
Copyright Notice

Diabetes in America is in the public domain of the United States. You may use the work without restriction in the United States.

NCBI Bookshelf. A service of the National Library of Medicine, National Institutes of Health.