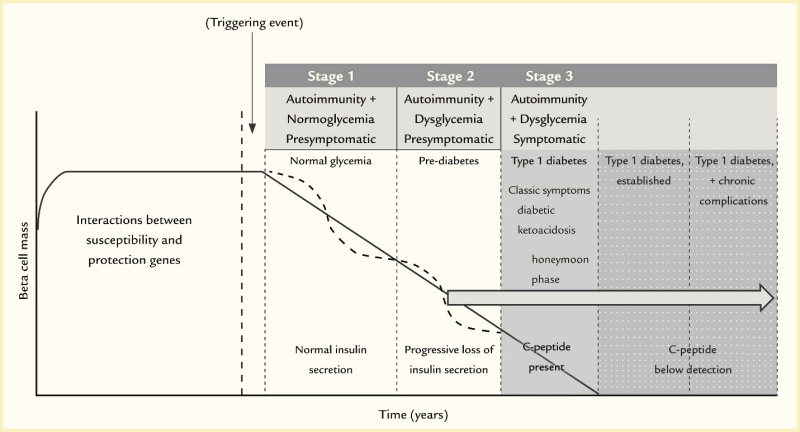
Line graph showing two theories of beta cell mass loss, including a linear loss of beta cells and stepped decline of beta cells with periods of plateaus, throughout the stages of type 1 diabetes.

FIGURE 1.

Stages of Type 1 Diabetes and Associated Reduction in Beta Cell Mass: Moving From a Linear Model of Beta Cell Loss to a More “Relapsing and Remitting” Model.

Moving beyond the pioneering linear model of beta cell loss (solid line) by Dr. George Eisenbarth, the rate and degree of beta cell loss are now thought to wax and wane (dotted line) during Stages 1 and 2 type 1 diabetes. The presence of two or more islet autoantibodies constitutes autoimmunity as defined in the image above.

SOURCE: Reference (4), modified from reference (39)

From: Prevention of Type 1 Diabetes

Cover of Diabetes in America
Diabetes in America [Internet].
Lawrence JM, Casagrande SS, Herman WH, et al., editors.
Copyright Notice

Diabetes in America is in the public domain of the United States. You may use the work without restriction in the United States.

NCBI Bookshelf. A service of the National Library of Medicine, National Institutes of Health.