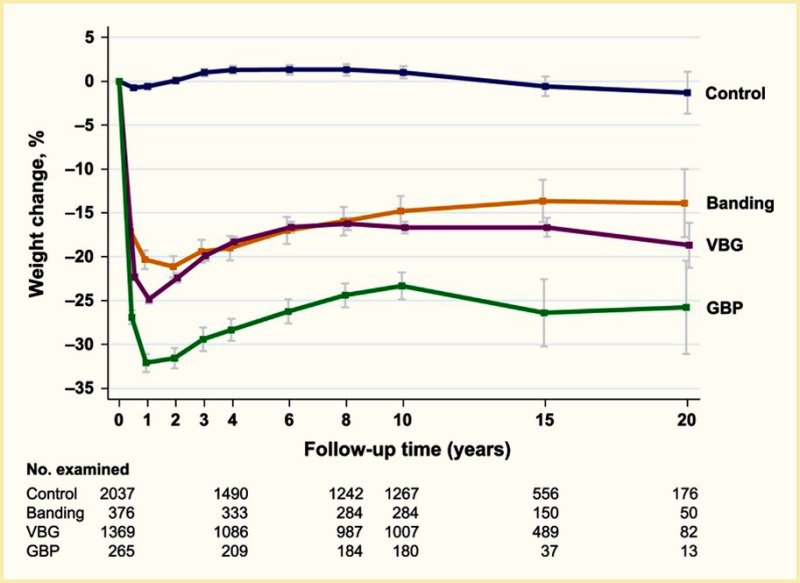
Line chart showing weight change over time for three types of metabolic surgery. Weight loss was greatest in the first two years following gastric bypass surgery.

FIGURE 1.

Weight Change After Metabolic Surgery, 20-Year Follow-Up, Swedish Obese Subjects Study.

Mean percentage weight change from baseline among patients in the control and three surgery groups during 20 years of follow‐up in the Swedish Obese Subjects study, a prospective controlled intervention study of metabolic surgery. Data are shown for controls receiving usual care and for surgery patients undergoing banding, vertical banded gastroplasty (VBG), or gastric bypass (GBP) at baseline. Percentage weight changes from the baseline examination are based on data available on 1 July 2011. Error bars represent 95% confidence intervals.

SOURCE: Reference (46). Reproduced with permission from JAMA. 2012. 307(1):56-65. Copyright ©2012 American Medical Association. All rights reserved.

From: Obesity Management for the Treatment of Type 2 Diabetes

Cover of Diabetes in America
Diabetes in America [Internet].
Lawrence JM, Casagrande SS, Herman WH, et al., editors.
Copyright Notice

Diabetes in America is in the public domain of the United States. You may use the work without restriction in the United States.

NCBI Bookshelf. A service of the National Library of Medicine, National Institutes of Health.