NCBI Bookshelf. A service of the National Library of Medicine, National Institutes of Health.

Adam MP, Feldman J, Mirzaa GM, et al., editors. GeneReviews® [Internet]. Seattle (WA): University of Washington, Seattle; 1993-2024.

Educational Materials — Genetic Testing: Current Approaches

, MD
Senior Editor, GeneReviews
Clinical Professor, Pediatrics
University of Washington
Seattle, Washington
, PhD
Molecular Genetics Editor, GeneReviews
Senior Director, Laboratory Quality Assurance
Perkin-Elmer Genomics, Inc
Pittsburgh, Pennsylvania

Initial Posting: ; Last Revision: June 18, 2020.

Estimated reading time: 30 minutes

Note: This information, provided by the editors of GeneReviews, is intended both for individuals who have limited experience with comprehensive genetic testing (see Introductory Information) and for clinicians who routinely order comprehensive genetic testing (see Detailed Information). – The Editors

Table of Contents
Introductory information Multigene panels
Clinical exome sequencing
Clinical genome sequencing
Chromosomal microarray (CMA)
Detailed information for clinicians ordering genetic tests
Multigene panels: FAQs What variables affect the diagnostic sensitivity of multigene panels?
What kinds of multigene panels are available?
How do off-the-shelf multigene panels compare with custom multigene panels?
What are the disadvantages of custom multigene panels compared to off-the-shelf multigene panels?
Comprehensive
genomic
testing
Clinical
exome
sequencing:
FAQs
When does exome sequencing provide the best test value?
What types of disorders can be reliably diagnosed by exome sequencing?
What types of genetic alterations cannot be reliably identified by exome sequencing?
What types of disorders are not reliably identified by exome sequencing?
What variables affect the sensitivity of exome sequencing?
Clinical
genome
sequencing:
FAQs
When does genome sequencing provide the best test value?
Benefits and limitations of genome sequencing
What types of disorders can be reliably diagnosed by genome sequencing?
What types of genetic alterations are not reliably identified by genome sequencing?
What types of disorders are not reliably identified by genome sequencing?
Comparison: multigene panels
& comprehensive genomic
testing
Advantages of multigene panels over exome sequencing and genome sequencing
Advantages of exome sequencing or genome sequencing over multigene panels
Chromosomal microarray (CMA) CMA compared to karyotype analysis
Determining pathogenicity of a CNV
Limitations of CMA
Types of CMA
Oligonucleotide array comparative genomic hybridization (oligo aCGH)
Single-nucleotide polymorphism genotyping array (SNP array)
Oligo/SNP combination array
Oligo aCGH vs SNP array: advantages of SNP arrays
Oligo aCGH vs SNP array: limitations of SNP arrays
References

Literature Cited

Suggested Reading

Introductory Information

This discussion addresses clinical tests available through CLIA-certified laboratories in the United States. Research testing is not discussed.

Multigene Panels

Many inherited disorders and phenotypes are genetically heterogeneous – that is, pathogenic variants in more than one gene can cause one phenotype (e.g., dilated cardiomyopathy, ataxia, hereditary hearing loss and deafness) or one genetic disorder (e.g., Noonan syndrome). Prior to the development of massively parallel sequencing (also known as next-generation sequencing), the only cost-effective way to test more than one gene was serial single-gene testing (i.e., complete testing of one gene that might account for the phenotype before proceeding to testing of the next gene) ‒ an expensive and time-consuming approach with a potentially low yield. In the past ten years, improvements in massively parallel sequencing techniques have led to the development and widespread clinical use of multigene panels, which allow simultaneous testing of two to more than 150 genes. The methods used in multigene panels may include sequence analysis, deletion/duplication analysis, and/or other non-sequencing-based tests.

There are two types of multigene panels:

  • Off the shelf. These are designed by a laboratory to include genes commonly associated with a broad phenotype (e.g., cardiomyopathy, ataxia, intellectual disability) or a recognizable syndrome with genetic heterogeneity (e.g., Noonan syndrome).
  • Custom designed. These include genes selected by a clinician for analysis by clinical sequencing. Results for each gene on the custom multigene panel are reported to the ordering clinician, whereas the results from the remaining genes sequenced (but not requested by the clinician) are not analyzed or included in the final laboratory report. Custom multigene panels offered by some reference laboratories are marketed under names such as XomeDxSlice® and ExomeNext-Select®.

Comprehensive Genomic Testing

Clinical Exome Sequencing

The human exome includes all coding nuclear DNA sequences, approximately 180,000 exons that are transcribed into mature RNA. (Note that mitochondrial DNA is not included in the exome.) Comprising only 1%-2% of the human genome, the exome nonetheless contains the majority of currently recognized disease-causing variants.

Exome sequencing is a laboratory test designed to identify and analyze the sequence of all protein-coding nuclear genes in the genome. Approximately 95% of the exome can be sequenced with currently available techniques. The diagnostic utility of exome sequencing has consistently been 20%-30% (i.e., a diagnosis is identified in 20%-30% of individuals who were previously undiagnosed but had features suggestive of a genetic condition) [Gahl et al 2012, Lazaridis et al 2016].

In the past five years, exome sequencing has increasingly become clinically available because:

  • Continuous improvements in massively parallel sequencing and bioinformatics tools for data analysis have lowered the cost and decreased the turn-around time;
  • Reports of clinically actionable results have led to improved coverage by medical insurance [Lazaridis et al 2016].

Clinical Genome Sequencing

The human genome includes all coding and noncoding nuclear and mitochondrial DNA sequences. Nuclear DNA encodes most of the more than 20,000 genes in humans; mitochondrial DNA encodes 37 genes. Most of the more than 3.2 billion base pairs that comprise the human genome are repetitive DNA or noncoding sequences – including noncoding RNAs, variants in which have been attributed to specific inherited disorders.

Genome sequencing is a laboratory test designed to identify and analyze the sequence of all coding and noncoding nuclear DNA. Mitochondrial DNA is part of the genome; however, mitochondrial sequencing is often ordered as a separate laboratory test.

Genome sequencing continues to be significantly more costly than exome sequencing because of the high cost of data analysis. However, the diagnostic utility (20%-30%) is roughly the same for the two test methods: although genome sequencing can identify variants outside of the coding regions, determination of pathogenicity of these variants is often not possible. Therefore, most confirmed pathogenic variants identified by genome sequencing are within exons [Taylor et al 2015].

Chromosomal Microarray

A chromosomal microarray (CMA) is a molecular genetic test used to detect copy number variants (CNVs); CNVs are deletions (loss) or duplications (gain) of chromosome material that range in size from approximately one kilobase (kb) to multiple megabases (Mb), with the largest CNVs resulting in a loss or gain of an entire chromosome. Depending on the size and genomic location of a CNV, the deletion or duplication may contain zero, one, or many genes. CNVs may be benign, pathogenic, or of uncertain clinical significance.

The most common types of CMA are oligonucleotide array comparative genomic hybridization (oligo aCGH), single-nucleotide polymorphism genotyping array (SNP array), and oligo aCGH / SNP combination array. CMA can be designed to identify deletions and duplications across the genome or in a targeted region(s) of the genome.

CMA is more sensitive at detecting CNVs than karyotype analysis, which has largely been supplanted by CMA. High-resolution karyotype analysis can detect deletions as small as 3-5 Mb and duplications larger than ~5 Mb, whereas most CMA can detect CNVs as small as 100 kb. Oligo aCGH arrays, specifically, can be designed to detect CNVs as small as a single exon.

CMA has been available as a clinical diagnostic test since 2004 and is recommended as a first-line test for individuals with developmental delay, intellectual disability, multiple congenital anomalies, and/or autism spectrum disorder. For these disorders, CMA has a diagnostic yield of 15%-20%, compared to the 3% yield of a traditional karyotype [Manning et al 2010, Miller et al 2010].

Detailed Information for Clinicians Ordering Genetic Tests

Multigene Panels: FAQs

What variables affect the diagnostic sensitivity of multigene panels?

  • The genes included in multigene panels vary by laboratory.
  • Methods used in a multigene panel may include sequence analysis, deletion/duplication analysis, and/or other non-sequencing-based tests.
  • Sequence enrichment methods vary.
  • Laboratories frequently update multigene panels to include analysis of:
    • Noncoding regions (e.g., promoters); and
    • Additional genes as they are discovered.

What kinds of multigene panels are available?

  • Off-the-shelf. These are designed by a laboratory to include genes commonly associated with a broad phenotype (e.g., ataxia, intellectual disability, cardiomyopathy) or a recognizable syndrome with genetic heterogeneity (e.g., Noonan syndrome). Off-the-shelf multigene panels may include additional test methods (e.g., deletion/duplication analysis or other non-sequencing-based tests).
  • Custom designed. These include genes selected by a clinician for analysis by sequencing. Sequencing results for each gene on the custom multigene panel are reported to the ordering clinician, whereas the sequencing data from the remaining genes sequenced (but not requested by the clinician) are not analyzed or included in the final laboratory report. Custom multigene panels offered by some reference laboratories are marketed under names such as XomeDxSlice® and ExomeNext-Select®.

How do off-the-shelf multigene panels compare with custom multigene panels?

  • Custom multigene panels allow clinicians to design a single molecular genetic test for individuals with multisystem involvement, for which one off-the-shelf multigene panel is not clinically available.
  • If a pathogenic variant(s) is not identified in one of the genes analyzed on the custom multigene panel, reflex analysis of other targeted genes may be faster and less expensive, and it typically does not require an additional sample from the individual being tested or from the biological parents of the individual being tested (if samples from the parents were sent when ordering the custom multigene panel).

What are the disadvantages of custom multigene panels compared to off-the-shelf multigene panels?

  • Clinical sensitivity for custom multigene panels is not known and may be lower than for larger panels.
  • Custom multigene panels cannot detect larger deletions or duplications within the genes of interest.
  • Custom multigene panels may not include ancillary assays necessary to cover regions with (e.g.) highly homologous pseudogenes, deep intronic pathogenic variants, and expanded nucleotide repeats.

Comprehensive Genomic Testing

Clinical Exome Sequencing: FAQs

When does exome sequencing provide the best test value?

  • When the clinical features in a patient are not highly suggestive of a known genetic condition
  • When the clinical features in a patient are suggestive of several genetic conditions that are not included in one multigene panel
  • When the clinical features in a patient and the family history are suggestive of a highly penetrant Mendelian condition that cannot be identified by phenotype alone

What types of disorders can be reliably diagnosed by exome sequencing?

  • Mendelian disorders caused by missense or nonsense variants that:
    • Are rare in the population; and
    • Have been previously reported as pathogenic in the literature or HGMD® (Human Gene Mutation Database)
  • Mendelian disorders caused by small insertions or deletions (<50 bp) within non-repetitive, coding DNA

What types of genetic alterations cannot be reliably identified by exome sequencing?

Exome sequencing requires sequence enrichment to target exons and sequence each exon. Genetic alterations that cannot reliably be detected by exome sequencing include alterations that:

  • Disrupt probe binding during the enrichment process; thus, the exon is not sequenced and not included in the analysis;
  • Influence gene expression without changing DNA sequence (e.g., imprinting errors, uniparental heterodisomy);
  • Are present in a highly repetitive region of DNA that is difficult to sequence (e.g., nucleotide repeat expansions and contractions);
  • Involve a gene that is highly homologous to other gene family members or a pseudogene;
  • Are present in a deep intronic (noncoding) region;
  • Are present in mitochondrial DNA, not nuclear DNA;
  • Are somatic mosaic changes (i.e., the genetic change is present in a small percentage of cells and not present in the germline, i.e., all cells); thus, either base calls do not pass quality thresholds or the genetic change was not present in the cells from which the DNA was extracted;
  • Result from large copy number variants (i.e., insertions or deletions >50 bp). Although copy number variants may be identified on exome sequencing by comparing actual read depth to expected read depth through intra- and inter-sample comparisons, variations in read depth (e.g., due to guanine-cytosine [GC] content of a region) can lead to false positive results.
  • Result from structural chromosome rearrangements (e.g., inversions, translocations). Note that chromosome rearrangements may be identified by using paired-end and mate-pair mapping to identify misalignment of sequences to a reference genome.

What types of disorders are not reliably identified by exome sequencing?

Disorders resulting from genetic alterations that are not reliably identified by exome sequencing because of technical limitations:

Genetic disorders that may not be recognized during analysis of exome sequencing due to unexpected inheritance pattern:

  • Disorders with incomplete penetrance or variable age of onset (e.g., variant present in an unaffected parent)
  • Disorders with previously unreported inheritance patterns (e.g., autosomal dominant inheritance in a disorder previously reported as autosomal recessive)

Disorders for which associated genes and/or pathogenic variants have not been reported:

  • Mendelian disorders associated with multiple unidentified genes
  • Disorders caused by pathogenic variants that are not described as disease-associated in the literature or HGMD®

Disorders that are not known to be genetic:

  • Conditions with a non-genetic etiology (e.g., fetal alcohol syndrome)
  • Conditions for which there is no known genetic etiology

What variables affect the sensitivity of exome sequencing?

Laboratory-dependent variables. Read depth (sometimes called exome coverage) and accuracy of base calling

  • "Read" refers to the nucleotide sequence generated from the laboratory process of sequencing a segment of DNA or RNA. Read depth refers to the number of times each nucleotide is sequenced. Read depth of an exome can vary significantly because some exons are easier to capture with probes and sequence than others. Read depth can refer to a single nucleotide, but is typically reported as the percentage of nucleotides that are sequenced either an average or minimum number of times (e.g., 30x average read depth for 95% of the exome).
    Exome coverage refers to the number of times each nucleotide is sequenced or the percentage of the exome sequenced an average or minimum number of times (e.g., 95% of exome at ≥20x coverage).
  • Accuracy of base calling, the reported nucleotide sequence compared to the actual nucleotide sequence, is measured by the Phred quality score. Phred scores are logarithmically related to nucleotide identification error probability. A Phred score of 10 indicates a one-in-ten chance of an inaccurate nucleotide determination. A Phred score of 20 indicates a one-in-100 chance of an inaccurate nucleotide determination, or a 99% likelihood of correct nucleotide assignment.

Additional laboratory-dependent variables. Sequence enrichment method used to target exons, sequencing technique, and length of sequence generated

  • Sequence enrichment method used to target exons: fixed array-based probes versus solution-based probes. Fixed array-based probes were the first method used to capture exons; while newer solution-based probes require less sample DNA, they may not capture regions with low GC content as well as array-based probes.
    Laboratories select probes that will target well-annotated genes associated with genetic conditions, thereby increasing the read depth of these genes. Laboratories frequently update the number of probes used in an assay to include noncoding regions of the genome (e.g., promoters, highly conserved regulatory sequences). Solution-based methods are more adaptable for updates than array-based methods.
  • Sequencing technique: paired-end reads (both ends of each DNA fragment are sequenced) versus single-end reads (only one end of a DNA fragment is sequenced). Paired-end reads are better than single-end reads at unambiguously determining alignment of a sequence to the reference exome, particularly in repetitive regions. However, sequencing of paired-end reads requires more laboratory time and is more expensive.
  • Length of sequence generated: longer reads reduce false positives that result from mapping ambiguity better than shorter reads.

Laboratory-dependent variables introduced by analysis of data. Application of filters and analysis of remaining unfiltered variants

  • Filters, applied during bioinformatics analysis, are used to select from the large number of variants identified by sequencing those variants that can be reasonably investigated for possible pathogenicity. Filters exclude variants that are unlikely to be disease related based on (a) the mode of inheritance inferred from the pedigree, (b) the frequency of a variant in the population, (c) a low Phred score, or (d) the prediction that a variant is non-pathogenic.
  • Variant classification guidelines updated by the American College of Medical Genetics and Genomics set forth objective variant classification methods [Richards et al 2015]. Nonetheless, to determine the pathogenicity of every variant identified, molecular and/or clinical geneticists in each laboratory develop their own approach to variant classification, often using the following:
    • Population databases (e.g., 1000 Genomes, ExAC, dbSNP)
    • Curated variant databases (HGVS, locus-specific databases, LOVD, ClinVar)
    • Published literature
    • Unpublished in-house laboratory data
    • In-silico predictive tools

Because the expertise of the molecular geneticist(s) and the data available vary, variant classification, and therefore clinical sensitivity, are laboratory dependent to some degree.

Laboratory-independent variables. Source of the DNA; GC (guanine-cytosine) content of the region

  • The source of DNA (e.g., blood, skin, saliva) affects the quantity and quality of DNA. For example, saliva samples have a lower quantity of DNA and higher contamination rates (e.g., bacterial DNA) than blood and skin samples. Lower DNA quantity will decrease achievable read depth. Higher contamination rates will decrease the accuracy of base calling.
  • The GC content of the region (i.e., proportion of guanine [G] and cytosine [C] nucleotides compared to adenine [A] and thymine [T] nucleotides) varies throughout the exome. Regions with high GC content (≥60%) (e.g., first exons, promoters) and low GC content (≤25%) are more difficult to sequence, resulting in decreased coverage of these regions compared to regions with a balanced number of nucleotides [Rieber et al 2013].

Clinical Genome Sequencing: FAQs

When does genome sequencing provide the best test value?

  • The clinical features in a proband are suggestive of known genetic conditions that are not included in one multigene panel or detectable by exome sequencing.
  • The clinical features in a proband appear consistent with somatic mosaicism but are not highly suggestive of a known syndrome.

Benefits and Limitations of Genome Sequencing

Genome sequencing is typically performed by next-generation sequencing of sheared genomic DNA. Genome sequencing techniques have nonstandardized, highly variable coverage.

While genome sequencing is significantly more costly than exome sequencing, it has distinct advantages:

  • Simpler sample preparation (no need for sequence enrichment strategies to target coding DNA that results in more even coverage [read depth] across coding regions)
  • The ability to identify structural variants and chromosome breakpoints in noncoding regions

The coverage of the genome is less than 100% and varies by laboratory. Telenti et al [2016] sequenced more than 10,000 genomes at a mean read depth of 30-40x (i.e., each DNA fragment was sequenced an average of 30 to 40 times); the authors reported that 91.5% of exons and 95.2% of known pathogenic variant positions could be sequenced with high confidence. The clinical sensitivity of genome sequencing is unknown.

Although genome sequencing can identify variants outside of the coding regions, most of the confirmed pathogenic variants identified by genome sequencing are within the exome [Taylor et al 2015]. The diagnostic utility of exome sequencing and genome sequencing (~20%-30%) remains similar. As more noncoding pathogenic variants are identified, the clinical sensitivity and value of genome sequencing should increase.

What types of disorders can be reliably diagnosed by genome sequencing?

Mendelian disorders caused by:

  • Missense or nonsense variants that:
    • Are rare in the population; and
    • Have been previously reported as pathogenic in the literature or HGMD® (Human Gene Mutation Database)
  • Small insertions or deletions (<50 bp) within non-repetitive DNA that:
    • Have been previously reported as pathogenic in the literature; or
    • Disrupt a gene reported in HGMD® (Human Gene Mutation Database)

What types of genetic alterations are not reliably identified by genome sequencing?

Alterations that:

  • Influence gene expression without changing DNA sequence (e.g., imprinting errors, uniparental heterodisomy);
  • Are present in a highly repetitive region of DNA that is difficult to sequence (e.g., nucleotide repeat expansions and contractions);
  • Involve a gene that is highly homologous to other gene family members or a pseudogene;
  • Are present in mitochondrial DNA, not nuclear DNA;
  • Are somatic mosaic changes (i.e., the genetic change is present in a small percentage of cells and absent in a large percentage of cells); thus, either base calls do not pass quality thresholds or the genetic change was not present in the cells from which the DNA was extracted.

What types of disorders are not reliably identified by genome sequencing?

Disorders caused by genetic alterations that are not identified on genome sequencing because of technical limitations:

Disorders for which associated genes and/or pathogenic variants have not been reported:

  • Mendelian disorders associated with multiple unidentified genes
  • Disorders caused by pathogenic variants that are not described as disease-associated in the literature or HGMD®

Disorders that are not known to be genetic:

  • Conditions with a non-genetic etiology (e.g., fetal alcohol syndrome)
  • Conditions for which there is no known genetic etiology

Comparison of Multigene Panels with Comprehensive Genomic Testing

Advantages of Multigene Panels over Exome Sequencing and Genome Sequencing

Clinical sensitivity (the ability to identify pathogenic variants causative of known clinical disorders) can be superior.

  • The sequences of genes included in a multigene panel have been specifically targeted and validated by the laboratory, whereas exome sequencing and genome sequencing are not gene specific. The design of multigene panels achieves the following:
    • Increases confidence in complete sequencing of a gene of interest
    • Enables monitoring of sequence performance over time in the region of interest, thus providing higher sensitivity for detecting somatic mosaic variants
    • Identifies variants within targeted noncoding regions (that may be missed on exome sequencing)
  • A multigene panels can be designed to include additional assays; for example:

Results can be easier to analyze. Because fewer genes are sequenced, fewer variants will be identified. Therefore, multigene panels often have the following advantages:

  • Faster turnaround time
  • Lower cost
  • No incidental findings (identification of pathogenic variants in genes that do not account for the patient phenotype that prompted the diagnostic testing)
  • No routine requirement of parental testing for interpretation of test results. Note: Parental samples are required to further evaluate variants of uncertain significance.

Advantages of Exome Sequencing or Genome Sequencing over Multigene Panels

Exome sequencing and genome sequencing do not require the clinician to determine which disorders (and, hence, which genes) are likely to be involved; thus, testing can be ordered earlier in a patient’s diagnostic evaluation because extensive clinical evaluations, laboratory testing, and radiographic evaluations are not needed to identify diagnostic clues that would lead the clinician to suspect a specific disorder(s).

Exome sequencing and genome sequencing can detect the presence of two or more genetically distinct disorders (the phenotypic presentation of which may have complicated diagnosis) in the same individual [Yang et al 2013, Adams et al 2014].

Using a multigene panel forces the clinician to select the best panel for the patient. Selection is often difficult because:

  • The less well defined the patient’s phenotype, the more difficult it is to identify the most appropriate multigene panel;
  • Genes for rare disorders or newly discovered genes may not be included in a multigene panel;
  • The testing method required to detect variants (e.g., exon or whole-gene deletions) commonly observed in some disorders may not be utilized in a given multigene panel;
  • The clinical sensitivity (which can vary widely among multigene panels) is not provided for some panels;
  • Laboratories with multigene panels comprising very similar lists of genes may manage variants of uncertain significance differently, potentially causing a substantial clinical burden in interpretation (e.g., testing additional family members to clarify the result), and genetic counseling (e.g., clarifying the difference between a pathogenic variant and a variant of uncertain significance). For example:
    • Laboratories may not reveal the probability of identifying a variant of uncertain significance, a factor to consider for large multigene panels for which the probability of identifying a variant of uncertain significance can exceed 75%;
    • Laboratories may not include variants of uncertain significance in the test result provided to the ordering clinician.

Chromosomal Microarray (CMA)

Background

A chromosomal microarray (CMA) is a molecular genetic test used to detect copy number variants (CNVs), i.e., deletions (loss) or duplications (gain) of chromosomal material. CNVs range in size from approximately one kilobase (kb) to multiple megabases (Mb), with the largest CNVs resulting in a loss or gain of an entire chromosome, or multiple chromosomes (such as a haploid set of 23 chromosomes). Depending on the size and genomic location of a CNV, the deletion or duplication may include no known genes, one gene, or many genes. CNVs may be benign, pathogenic, or of uncertain clinical significance.

Prior to the development of CMA, detection of CNVs was limited to what could be seen on high-resolution karyotype analysis (i.e., deletions as small as three to five Mb and duplications larger than approximately five Mb). Identification of smaller CNVs using fluorescent in situ hybridization (FISH) analysis required the clinician to determine the chromosome region of interest. In contrast, CMA can detect CNVs smaller than those identified with high-resolution karyotype analysis, and the clinician does not need to determine a region of interest. CMA, which has been available as a clinical diagnostic test since 2004, is recommended as a first-line test for individuals with developmental delay, intellectual disability, multiple congenital anomalies, and/or autism spectrum disorder. For these disorders, the diagnostic yield of CMA (15%-20%) is greater than that of karyotype analysis (~3%) [Manning et al 2010, Miller et al 2010].

The sensitivity of CMA depends on the following:

  • Region of the genome covered by the probes selected
  • Number of probes used
  • Spacing (density) of the probes

CMA Compared to Karyotype Analysis

Advantages of CMA compared to karyotype analysis

  • CMA can detect smaller deletions and duplications than those visible on karyotype analysis.
  • CMA analysis can be targeted to a specific gene, region(s) of the genome, or exons of disease-related genes to decrease the chance of detecting a variant of uncertain significance. (See Types of CMA.)
  • CMA can be performed more quickly and on a wider variety of samples than karyotype analysis because CMA uses isolated DNA rather than cultured cells, and the process of CMA analysis requires less manual analysis than evaluating a karyotype.

Limitations of CMA compared to karyotype analysis

  • CMA cannot detect balanced chromosome rearrangements (e.g., balanced translocations, inversions).
  • CMA cannot determine the genomic location of a duplicated sequence. While most duplications occur in tandem [Newman et al 2015], a minority are inverted duplications or insertions (i.e., a duplicated CNV is inserted into another location in the genome). To determine the location and orientation of a duplication, other methods such as FISH or genome sequencing must be used.

Determining Pathogenicity of a CNV

The American College of Medical Genetics and Genomics (ACMG) and the Clinical Genome Resource (ClinGen) have recently introduced a technical standard for interpretation of CNVs using an evidence-based scoring system [Riggs et al 2020]. This guidance considers several factors when evaluating the potential pathogenicity of a CNV detected by CMA [Miller et al 2010] including:

  • Gene content. CNVs containing one or more disease-related genes may be pathogenic. The effect of a CNV that does not include known genes is difficult to predict.
  • Size. Larger CNVs are more likely to be pathogenic. However, at least 1% of unaffected individuals have a CNV >1 Mb [Itsara et al 2009].
  • Presence of the CNV in affected individuals. A similar or overlapping CNV in another affected individual supports pathogenicity of the CNV.
  • Presence of the CNV in population databases. A CNV that is frequently identified in unaffected individuals is less likely to be pathogenic.
  • Inheritance. A de novo CNV in a severe condition that tends to affect only one family member is more likely to be pathogenic than a CNV inherited from an unaffected parent. Conversely, inherited CNVs may be pathogenic, which can be confirmed by segregation analysis (i.e., targeted testing of the CNV in additional family members to determine if the CNV is segregating with the disorder).

Common characteristics of pathogenic or likely pathogenic CNVs

  • A recurrent deletion or duplication known to be disease-related and consistent with the affected individual's phenotype (see Table 1). The breakpoints of recurrent CNVs are the same in unrelated individuals as the result of nonallelic homologous recombination.
  • A nonrecurrent deletion or duplication previously associated with the affected individual's phenotype. The breakpoints of nonrecurrent CNVs are different and may be overlapping in unrelated individuals.
  • A deletion involving a known disease-related gene for which loss of function (haploinsufficiency) is the disease mechanism
  • A large, de novo deletion encompassing multiple genes

Common characteristics of CNVs of uncertain significance

  • A duplication involving a known disease-related gene in which pathogenic variants cause haploinsufficiency
  • A deletion involving a known disease-related gene in which pathogenic variants cause gain of function
  • A heterozygous deletion of a disease-related gene for an autosomal recessive disorder in an individual who does not have a second pathogenic variant identified in the disease-related gene and/or does not have features suggestive of the autosomal recessive disorder

Common characteristics of benign or likely benign CNVs

  • A CNV that is frequent in the general population
  • A CNV that is inherited from an unaffected parent, unless the CNV causes a disorder known to have reduced penetrance

Table 1.

Syndromes Caused by Recurrent Deletions and Duplications

Deletion/Duplication Syndrome (Chromosome Locus) 1Approximate SizeISCA ID 2Region Location 3Genes of
Interest in
This Region
1q21.1 recurrent microdeletion 1.35 MbISCA-37421GRCh38/hg38 chr1: 147,105,904-147,922,392 GJA5
GJA8
3q29 recurrent deletion 1.6 MbISCA-37443GRCh38/hg38 chr3: 196,029,183-197,617,791 DLG1
FBXO45
PAK2
RNF168
3q29 duplication syndrome (OMIM 611936)
Sotos syndrome
(5q35 deletion)
1.9 MbISCA-37425GRCh38/hg38 chr5: 176,301,976-177,620,792 NSD1
Williams syndrome (7q11.23 deletion)1.5-1.8 MbISCA-37392GRCh38/hg38 chr7: 73,330,452-74,728,172 LIMK1
FTF2I
STX1A
BAZ1B
CLIP2
GTF2IRD1
NCF1
7q11.23 duplication syndrome ELN
GTF2I
10q22.3-q23.2 deletion syndrome (OMIM 612242)7 MbISCA-37424GRCh38/hg38 chr10: 79,923,087-86,979,631 BMPR1A
GRID1
NRG3
Angelman syndrome
(15q11.2-q13 maternal deletion)
7 Mb 4ISCA-37404GRCh38/hg38 chr15: 22,782,170-28,134,728 UBE3A
5 Mb 5ISCA-37478GRCh38/hg38 chr15: 23,465,365-28,134,728
Prader-Willi syndrome
(15q11.2-q13 paternal deletion)
7 Mb 4ISCA-37404GRCh38/hg38 chr15: 22,782,170-28,134,728 SNURF-SNRPN
OCA2
NECDIN
MAGEL2
SNORD116
5 Mb 5ISCA-37478GRCh38/hg38 chr15: 23,465,365-28,134,728
15q duplication syndrome 6
(15q11.2-q13.1)
7 Mb 4ISCA-37404GRCh38/hg38 chr15: 22,782,170-28,134,729 UBE3A
GABRB3
GABRA5
GABRG3
HERC2
5 Mb 5ISCA-37478GRCh38/hg38 chr15: 23,513,243-28,312,040
15q13.3 microdeletion ~2.0 Mb 7ISCA-37411GRCh38/hg38 chr15: 30,900,686-32,153,204 CHRNA7
OTUD7A
16p12.2 recurrent deletion 520 kbNAGRCh37/ hg19 chr 16: ~21,950,000-~22,470,000 UQCRC2
CDR2
POLR3E
EEF2K
MOSMO
16p11.2 recurrent microdeletion 593 kbISCA-37400GRCh38/hg38 chr16: 29,638,676-30,188,531 PRRT2
KCTD13
TBX6
16p11.2 duplication syndrome (OMIM 614671)593 kbUnknown
16p11.2 deletion syndrome, 220-kb (OMIM 613444)220 kbISCA-37486GRCh38/hg38 chr16: 28,811,314-29,035,178 SH2B1
Hereditary neuropathy with liability to pressure palsies
(17p12 deletion)
1.5 MbISCA-37436GRCh38/hg38 chr17: 14,194,598-15,519,638 PMP22
Charcot-Marie-Tooth neuropathy type 1A (17p12 duplication; OMIM 118220)
Smith-Magenis syndrome (17p11.2 deletion)3.7 MbISCA-37418GRCh38/hg38 chr17: 16,906,714-20,309,889 RAI1
Potocki-Lupski syndrome (17p11.2 duplication)
Neurofibromatosis 1 (17q11.2 deletion)1.0-1.4 MbISCA-37431GRCh38/hg38 chr17: 30,780,079-31,937,008 NF1
17q11.2 duplication syndrome (OMIM 613675)
17q12 recurrent deletion syndrome 1.4 MbISCA-37432GRCh38/hg38 chr17: 36,458,167-37,854,616 ACACA
LHX1
HNF1B
17q12 recurrent duplication HNF1B
Koolen-de Vries syndrome (17q21.31 deletion)500 kbISCA-37420GRCh38/hg38 chr17: 45,627,800-46,087,514 KANSL1
22q11.2 deletion syndrome 1.5 MbISCA-37433GRCh38/hg38 chr22: 18,924,718-20,299,685 TBX1
3 MbISCA-37446GRCh38/hg38 chr22: 18,924,718-21,111,383
22q11.2 duplication (OMIM 608363)1.5 MbISCA-37433GRCh38/hg38 chr22: 18,924,718-20,299,685Unknown
3 MbISCA-37446GRCh38/hg38 chr22: 18,924,718-21,111,383
22q11.2 deletion syndrome, distal (OMIM 611867)1.1-2.1 Mb 9ISCA-37397GRCh38/hg38 chr22: 21,562,828-23,306,924 TOP3B
22q11.2 duplication syndrome, distal 8Unknown
Xq28 duplication (OMIM 300815)0.3 MbISCA-37439GRCh38/hg38 chrX: 154,396,223-154,555,683 GDI1
Xq28 duplication syndrome, Int22h1/Int22h2 mediated 0.5 MbISCA-37494GRCh38/hg38 chrX: 154,890,328-155,335,092 CLIC2
RAB39B
1.

Data are compiled from the following standard references: chromosome locus from OMIM, genes from HGNC.

2.

Standardized clinical annotation and interpretation for genomic variants from the Clinical Genome Resource (ClinGen) project (formerly the International Standards for Cytogenomic Arrays [ISCA] Consortium)

3.

Genomic coordinates represent the minimum deletion/duplication size as designated by ClinGen. Coordinates may vary slightly based on array design used by the testing laboratory. Note that the size of the microdeletion/microduplication as calculated from these genomic positions may differ from the expected size due to the presence of segmental duplications near breakpoints.

4.

Class 1 deletion/duplication, extending from BP1 to BP3

5.

Class 2 deletion/duplication, extending from BP2 to BP3

6.

Approximately 80% of individuals have a maternal isodicentric 15q11.2-q13.1 supernumerary chromosome – idic(15) – that typically comprises two extra copies of 15q11.2-q13.1, resulting in tetrasomy for 15q11.2-q13.1. Approximately 20% of individuals have one extra copy.

7.

Extending from BP4 to BP5

8.
9.

Includes deletions extending from LCR22-D to either LCR22-E or –F

Limitations of CMA

Pathogenic variants that cannot be reliably detected regardless of CMA platform

  • Single-nucleotide variants
  • Small (<1000 base-pair) insertions or deletions
  • Nucleotide repeat expansions
  • Balanced chromosome rearrangements, including inversions and balanced translocations
  • Methylation defects
  • Some supernumerary chromosomes, particularly those primarily containing heterochromatin

Types of CMA

Genome-wide CMAs interrogate the entire genome for CNVs as small as 100 kb. Probes cover the genome with an increased number and density over chromosome regions associated with known microdeletions/microduplications (Table 1).

Exon-focused CMAs detect CNVs that involve one or more exons. A high number of densely spaced probes cover each exon, increasing the resolution of the CMA for expressed genes.

Customized CMAs detect CNVs within a specific region of interest, either intra- or inter-genic, using a high number of densely spaced probes that cover a specific genomic region.

Note: All CMAs have genome-wide probe coverage, although the coverage may be minimal, to allow for quality control and data analysis.

The most common CMA platforms:

Oligonucleotide Array Comparative Genomic Hybridization

Oligonucleotide array comparative genomic hybridization (oligo aCGH) detects differences in DNA content (copy number) between two individuals, usually an affected individual and a healthy control. DNA from an affected individual is fluorescently labeled with one dye; DNA from a healthy control is labeled with a different dye. The DNA samples are co-hybridized to an array in which hundreds of thousands of oligonucleotide probes are attached to the surface. After time to allow hybridization, the excess DNA is washed off, and the fluorescent signals are measured from each dye at each oligonucleotide. The fluorescence intensity of hybridized DNA from an affected individual and fluorescence intensity of hybridized DNA from the healthy control are measured, and the ratio of the fluorescence intensity for each dye is plotted on a log2 scale.

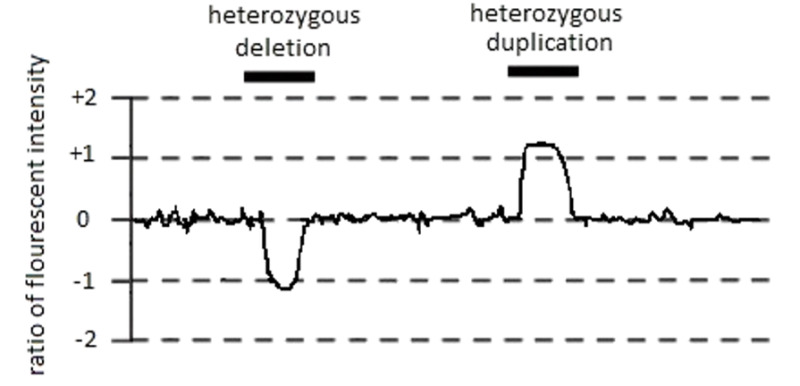
A log2 ratio of zero indicates a normal DNA copy number in the affected individual, whereas a reduced log2 ratio indicates a deletion, and an increased log2 ratio indicates a duplication (see Figure 1). Because a single oligonucleotide probe with an aberrant log2 ratio may represent laboratory artifact, several adjacent oligonucleotide probes with the same deviation are required to confirm the presence of a CNV. The number of adjacent probes required to confirm the presence of a CNV is determined by the laboratory performing the test. Due to the comparative nature of the analysis, same-sex control are used and ploidy abnormalities cannot be detected.

Single-Nucleotide Polymorphism Genotyping Array

Single-nucleotide polymorphism genotyping arrays (SNP arrays) determine the genotype of an individual at selected single base pair sites in that person's genome. These single base pair sites are selected because they are likely to be polymorphic (i.e., the nucleotide at the site varies among individuals). Typically, at each polymorphic site (SNP), there are two possible alleles: the major (or reference) allele referred to as the "A" allele, and the minor (non-reference) allele referred to as the "B" allele. At each SNP, an individual may be homozygous for the reference allele (AA), a compound heterozygote for the reference allele and the non-reference allele (AB), or homozygous for the non-reference allele (BB).

Similar to oligo aCGH, SNP arrays also rely on fluorescence-based visualization of genomic DNA bound to oligonucleotide probes fixed to an array. However, rather than the comparative hybridization of two samples used in oligo aCGH, SNP arrays hybridize DNA fragments from the affected individual's sample in an allele-specific manner. The "A" allele is labeled with one fluorescent signal and the "B" allele is labeled with a different fluorescent signal.

The two pieces of information gathered for each SNP (see Figure 2):

1.

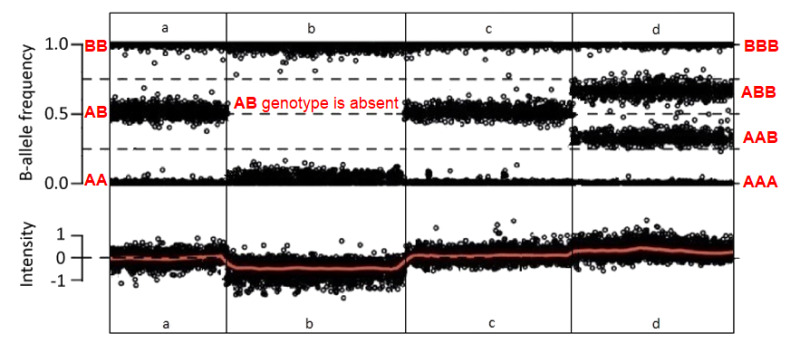
The relative fluorescence intensity for the two alleles at each site, which represents the allelic ratio, referred to as B-allele frequency. Most of the genome is diploid (each chromosome and thus each allele is present in two copies); therefore, an individual will have an "AA," "AB," or "BB" genotype at each SNP, and the B-allele frequency will be 0, 0.5 or 1, respectively. If the SNP is in a deleted region, the genotype (i.e., "A" or "B") will appear homozygous (i.e., "AA" or "BB"), with a B-allele frequency of 0 or 1, respectively. If the SNP is in a region of a duplication, the possible genotypes for each SNP include: "AAA," "AAB," "ABB," or "BBB" with a B-allele frequency of 0, 0.3, 0.6, or 1, respectively.

2.

The total fluorescence intensity indicates the number of alleles at a specific SNP in an individual. The data are normalized using external control samples and plotted on a log2 scale. An individual with two alleles at a specific SNP will have a log2 ratio of zero. An individual with a heterozygous deletion that includes the SNP will have a reduced log2 ratio. An individual with a heterozygous duplication including the SNP will have an increased log2 ratio.

CNVs are identified using a combination of the B-allele frequency and total fluorescence intensity of adjacent SNPs; several adjacent SNPs with the same deviation are required to confirm the presence of a CNV.

Oligo/SNP Combination Array

Oligo/SNP combination arrays use an oligo aCGH platform that includes both oligonucleotide probes to identify CNVs and probes for select SNPs. The number (and therefore the density) of SNP probes is usually much lower in combination arrays than in SNP genotyping arrays. However, the inclusion of SNP probes allows for the detection of uniparental isodisomy and large stretches of copy-neutral homozygosity (see Oligo aCGH vs SNP Array).

Oligo aCGH vs SNP Array: Advantages of SNP Arrays

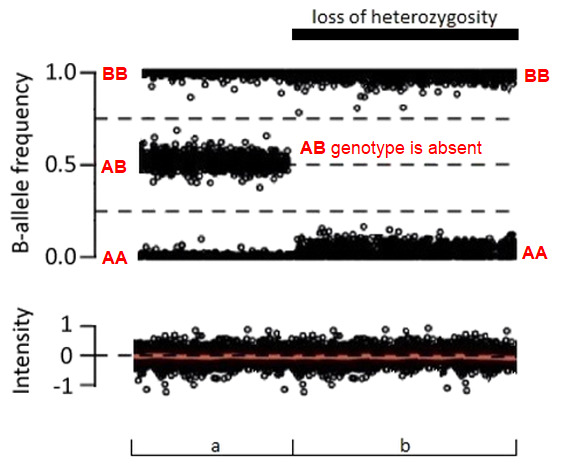
SNP arrays can detect regions of copy-neutral homozygosity (regions of the genome that are diploid and identical). In stretches of copy-neutral homozygosity, all SNPs are homozygous ("AA" or "BB"), but the total fluorescence intensity is at the same level as diploid regions of the genome (see Figure 3). Identification of regions of copy-neutral homozygosity may help identify:

  • Uniparental isodisomy (i.e., two copies of a single chromosome or chromosome segment are inherited from one parent and no copy is inherited from the other parent).). A region of homozygosity limited to one chromosome pair or chromosome segment can be detected by SNP array in individuals with uniparental isodisomy.
    Complete uniparental heterodisomy (i.e., both chromosomes of a chromosome pair or chromosome segment are inherited from one parent and no copy is inherited from the other parent) is not detectable by SNP array because heterodisomy will result in heterozygous SNPs and no regions of homozygosity.
  • Parental relatedness. SNP arrays can identify an excess of homozygosity in a proband usually indicating parental consanguinity, which is often known, or revealing incest / potential abuse. Region(s) of homozygosity can help narrow the search for disease-causing genes particularly in individuals from highly consanguineous populations [Alabdullatif et al 2017].

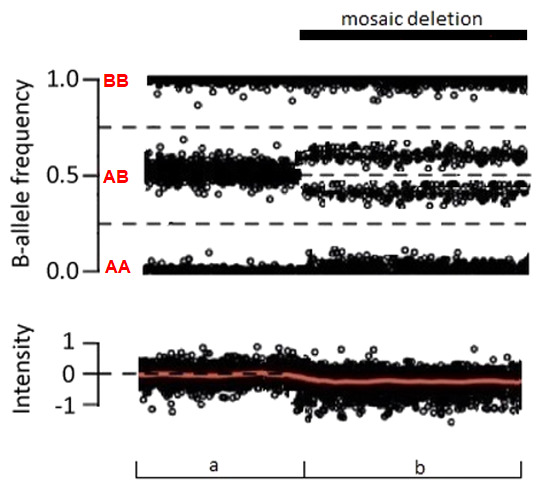
SNP arrays can detect a lower level of mosaicism than oligo aCGH. SNP arrays can detect mosaicism for CNVs present in ≥5% of the cells tested including gain or loss of a whole chromosome (i.e., aneuploidy) (see Figure 4) [Conlin et al 2010]. Oligo aCGH is slightly less sensitive, detecting mosaicism present in ≥10%-20% of cells tested.

SNP array can detect polyploidy (e.g., triploidy) which cannot be reliably detected by oligo aCGH as the presence of three fluorescence intensity ratios are normalized.

Oligo aCGH vs SNP Array: Limitations of SNP Arrays

SNP arrays are more difficult to customize than oligo arrays because some regions of the genome are less variable than others. For example, exons are less likely to have nucleotides that vary among individuals. In fact, some exons do not have any variable nucleotides. As oligo aCGH does not require variability for its probes, oligo probes can cover exons that are identical among most individuals.

Resources

Population Databases

Database of Genomic Variants: dgv.tcag.ca/dgv/app/home

Curated Variant Databases

ClinGen Dosage Sensitivity Map: www.ncbi.nlm.nih.gov/projects/dbvar/clingen

DECIPHER: decipher.sanger.ac.uk

ECARUCA: www.ecaruca.net

References

Literature Cited

  • Adams DR, Yuan H, Holyoak T, Arajs KH, Hakimi P, Markello TC, Wolfe LA, Vilboux T, Burton BK, Fajardo KF, Grahame G, Holloman C, Sincan M, Smith AC, Wells GA, Huang Y, Vega H, Snyder JP, Golas GA, Tifft CJ, Boerkoel CF, Hanson RW, Traynelis SF, Kerr DS, Gahl WA. Three rare diseases in one sib pair: RAI1, PCK1, GRIN2B mutations associated with Smith-Magenis Syndrome, cytosolic PEPCK deficiency and NMDA receptor glutamate insensitivity. Mol Genet Metab. 2014;113:161–70. [PMC free article: PMC4219933] [PubMed: 24863970]
  • Alabdullatif MA, Al Dhaibani MA, Khassawneh MY, El-Hattab AW. Chromosomal microarray in a highly consanguineous population: diagnostic yield, utility of regions of homozygosity, and novel mutations. Clin Genet. 2017;91:616–22. [PubMed: 27717089]
  • Conlin LK, Thiel BD, Bonnemann CG, Medne L, Ernst LM, Zackai EH, Deardorff MA, Krantz ID, Hakonarson H, Spinner NB. Mechanisms of mosaicism, chimerism and uniparental disomy identified by single nucleotide polymorphism array analysis. Hum Mol Genet. 2010;19:1263–75. [PMC free article: PMC3146011] [PubMed: 20053666]
  • Gahl WA, Markello TC, Toro C, Fajardo KF, Sincan M, Gill F, Carlson-Donohoe H, Gropman A, Pierson TM, Golas G, Wolfe L, Groden C, Godfrey R, Nehrebecky M, Wahl C, Landis DM, Yang S, Madeo A, Mullikin JC, Boerkoel CF, Tifft CJ, Adams D. The National Institutes of Health Undiagnosed Diseases Program: insights into rare diseases. Genet Med. 2012;14:51–9. [PMC free article: PMC4098846] [PubMed: 22237431]
  • Itsara A, Cooper GM, Baker C, Girirajan S, Li J, Absher D, Krauss RM, Myers RM, Ridker PM, Chasman DI, Mefford H, Ying P, Nickerson DA, Eichler EE. Population analysis of large copy number variants and hotspots of human genetic disease. Am J Hum Genet. 2009;84:148–61. [PMC free article: PMC2668011] [PubMed: 19166990]
  • Lazaridis KN, Schahl KA, Cousin MA, Babovic-Vuksanovic D, Riegert-Johnson DL, Gavrilova RH, McAllister TM, Lindor NM, Abraham RS, Ackerman MJ, Pichurin PN, Deyle DR, Gavrilov DK, Hand JL, Klee EW, Stephens MC, Wick MJ, Atkinson EJ, Linden DR, Ferber MJ, Wieben ED, Farrugia G, et al. Outcome of whole exome sequencing for diagnostic odyssey cases of an individualized medicine clinic: the Mayo Clinic experience. Mayo Clin Proc. 2016;91:297–307. [PubMed: 26944241]
  • Manning M, Hudgins L, et al. Array-based technology and recommendations for utilization in medical genetics practice for detection of chromosomal abnormalities. Genet Med. 2010;12:742–5. [PMC free article: PMC3111046] [PubMed: 20962661]
  • Miller DT, Adam MP, Aradhya S, Biesecker LG, Brothman AR, Carter NP, Church DM, Crolla JA, Eichler EE, Epstein CJ, Faucett WA, Feuk L, Friedman JM, Hamosh A, Jackson L, Kaminsky EB, Kok K, Krantz ID, Kuhn RM, Lee C, Ostell JM, Rosenberg C, Scherer SW, Spinner NB, Stavropoulos DJ, Tepperberg JH, Thorland EC, Vermeesch JR, Waggoner DJ, Watson MS, Martin CL, Ledbetter DH. Consensus statement: chromosomal microarray is a first-tier clinical diagnostic test for individuals with developmental disabilities or congenital anomalies. Am J Hum Genet. 2010;86:749–64. [PMC free article: PMC2869000] [PubMed: 20466091]
  • Newman S, Hermetz KE, Weckselblatt B, Rudd MK. Next-generation sequencing of duplication CNVs reveals that most are tandem and some create fusion genes at breakpoints. Am J Hum Genet. 2015;96:208–20. [PMC free article: PMC4320257] [PubMed: 25640679]
  • Richards S, Aziz N, Bale S, Bick D, Das S, Gastier-Foster J, Grody WW, Hegde M, Lyon E, Spector E, Voelkerding K, Rehm HL, et al. Standards and guidelines for the interpretation of sequence variants: a joint consensus recommendation of the American College of Medical Genetics and Genomics and the Association for Molecular Pathology. Genet Med. 2015;17:405–24. [PMC free article: PMC4544753] [PubMed: 25741868]
  • Rieber N, Zapatka M, Lasitschka B, Jones D, Northcott P, Hutter B, Jäger N, Kool M, Taylor M, Lichter P, Pfister S, Wolf S, Brors B, Eils R. Coverage bias and sensitivity of variant calling for four whole-genome sequencing technologies. PLoS One. 2013;8:e66621. [PMC free article: PMC3679043] [PubMed: 23776689]
  • Riggs ER, Andersen EF, Cherry AM, Kantarci S, Kearney H, Patel A, Raca G, Ritter DI, South ST, Thorland EC, Pineda-Alvarez D, Aradhya S, Martin CL, et al. Technical standards for the interpretation and reporting of constitutional copy-number variants: a joint consensus recommendation of the American College of Medical Genetics and Genomics (ACMG) and the Clinical Genome Resource (ClinGen). Genet Med. 2020;22:245–57. [PMC free article: PMC7313390] [PubMed: 31690835]
  • Taylor JC, Martin HC, Lise S, Broxholme J, Cazier JB, Rimmer A, Kanapin A, Lunter G, Fiddy S, Allan C, Aricescu AR, Attar M, Babbs C, Becq J, Beeson D, Bento C, Bignell P, Blair E, Buckle VJ, Bull K, Cais O, Cario H, Chapel H, Copley RR, Cornall R, Craft J, Dahan K, Davenport EE, Dendrou C, Devuyst O, Fenwick AL, Flint J, Fugger L, Gilbert RD, Goriely A, Green A, Greger IH, Grocock R, Gruszczyk AV, Hastings R, Hatton E, Higgs D, Hill A, Holmes C, Howard M, Hughes L, Humburg P, Johnson D, Karpe F, Kingsbury Z, Kini U, Knight JC, Krohn J, Lamble S, Langman C, Lonie L, Luck J, McCarthy D, McGowan SJ, McMullin MF, Miller KA, Murray L, Németh AH, Nesbit MA, Nutt D, Ormondroyd E, Oturai AB, Pagnamenta A, Patel SY, Percy M, Petousi N, Piazza P, Piret SE, Polanco-Echeverry G, Popitsch N, Powrie F, Pugh C, Quek L, Robbins PA, Robson K, Russo A, Sahgal N, van Schouwenburg PA, Schuh A, Silverman E, Simmons A, Sørensen PS, Sweeney E, Taylor J, Thakker RV, Tomlinson I, Trebes A, Twigg SR, Uhlig HH, Vyas P, Vyse T, Wall SA, Watkins H, Whyte MP, Witty L, Wright B, Yau C, Buck D, Humphray S, Ratcliffe PJ, Bell JI, Wilkie AO, Bentley D, Donnelly P, McVean G. Factors influencing success of clinical genome sequencing across a broad spectrum of disorders. Nat Genet. 2015;47:717–26. [PMC free article: PMC4601524] [PubMed: 25985138]
  • Telenti A, Pierce LC, Biggs WH, di Iulio J, Wong EH, Fabani MM, Kirkness EF, Moustafa A, Shah N, Xie C, Brewerton SC, Bulsara N, Garner C, Metzker G, Sandoval E, Perkins BA, Och FJ, Turpaz Y, Venter JC. Deep sequencing of 10,000 human genomes. Proc Natl Acad Sci U S A. 2016;113:11901–6. [PMC free article: PMC5081584] [PubMed: 27702888]
  • Wincent J, Bruno DL, van Bon BW, Bremer A, Stewart H, Bongers EM, Ockeloen CW, Willemsen MH, Keays DD, Baird G, Newbury DF, Kleefstra T, Marcelis C, Kini U, Stark Z, Savarirayan R, Sheffield LJ, Zuffardi O, Slater HR, de Vries BB, Knight SJ, Anderlid BM, Schoumans J. Sixteen new cases contributing to the characterization of patients with distal 22q11.2 microduplications. Mol Syndromol. 2010;1:246-54. [PMC free article: PMC3214948] [PubMed: 22140377]
  • Yang Y, Muzny DM, Reid JG, Bainbridge MN, Willis A, Ward PA, Braxton A, Beuten J, Xia F, Niu Z, Hardison M, Person R, Bekheirnia MR, Leduc MS, Kirby A, Pham P, Scull J, Wang M, Ding Y, Plon SE, Lupski JR, Beaudet AL, Gibbs RA, Eng CM. Clinical whole-exome sequencing for the diagnosis of mendelian disorders. N Engl J Med. 2013;369:1502–11. [PMC free article: PMC4211433] [PubMed: 24088041]

Suggested Reading

  • Asan Xu Y, Jiang H, Tyler-Smith C, Xue Y, Jiang T, Wang J, Wu M, Liu X, Tian G, Wang J, Wang J, Yang H, Zhang X. Comprehensive comparison of three commercial human whole-exome capture platforms. Genome Biol. 2011;12:R95. [PMC free article: PMC3308058] [PubMed: 21955857]
  • Basgalupp SP, Siebert M, Vairo FP, Chami AM, Pinto LL, Carvalho GD, Schwartz IV. Use of a multiplex ligation-dependent probe amplification method for the detection of deletions/duplications in the GBA1 gene in Gaucher disease patients. Blood Cells Mol Dis. 2018;68:17–20. [PubMed: 27825739]
  • Bishop CL, Strong KA, Dimmock DP. Choices of incidental findings of individuals undergoing genome wide sequencing, a single center's experience. Clin Genet. 2017;91:137–140. [PubMed: 27392285]
  • Essebier A, Vera Wolf P, Cao MD, Carroll BJ, Balasubramanian S, Bodén M. Statistical enrichment of epigenetic states around triplet repeats that can undergo expansions. Front Neurosci. 2016;10:92. [PMC free article: PMC4782033] [PubMed: 27013954]
  • Genome in a Bottle Consortium (www​.genomeinabottle.org)
  • Gymrek M, Willems T, Guilmatre A, Zeng H, Markus B, Georgiev S, Daly MJ, Price AL, Pritchard JK, Sharp AJ, Erlich Y. Abundant contribution of short tandem repeats to gene expression variation in humans. Nat Genet. 2016;48:22–9. [PMC free article: PMC4909355] [PubMed: 26642241]
  • Hesson LB, Ward RL. Discrimination of pseudogene and parental gene DNA methylation using allelic bisulfite sequencing. Methods Mol Biol. 2014;1167:265–74. [PubMed: 24823784]
  • Hong G, Park HD, Choi R, Jin DK, Kim JH, Ki CS, Lee SY, Song J, Kim JW. CYP21A2 mutation analysis in Korean patients with congenital adrenal hyperplasia using complementary methods: sequencing after long-range PCR and restriction fragment length polymorphism analysis with multiple ligation-dependent probe amplification assay. Ann Lab Med. 2015;35:535–9. [PMC free article: PMC4510508] [PubMed: 26206692]
  • Huizing M, Anikster Y, Gahl WA. Characterization of a partial pseudogene homologous to the Hermansky-Pudlak syndrome gene HPS-1; relevance for mutation detection. Hum Genet. 2000;106:370–3. [PubMed: 10798370]
  • Kozlowski P, de Mezer M, Krzyzosiak WJ. Trinucleotide repeats in human genome and exome. Nucleic Acids Res. 2010;38:4027–39. [PMC free article: PMC2896521] [PubMed: 20215431]
  • Majewski J, Schwartzentruber J, Lalonde E, Montpetit A, Jabado N. What can exome sequencing do for you? J Med Genet. 2011;48:580–9. [PubMed: 21730106]
  • Mulchandani S, Bhoj EJ, Luo M, Powell-Hamilton N, Jenny K, Gripp KW, Elbracht M, Eggermann T, Turner CL, Temple IK, Mackay DJ, Dubbs H, Stevenson DA, Slattery L, Zackai EH, Spinner NB, Krantz ID, Conlin LK. Maternal uniparental disomy of chromosome 20: a novel imprinting disorder of growth failure. Genet Med. 2016;18:309–15. [PubMed: 26248010]
  • Pfendner EG, Uitto J, Gerard GF, Terry SF. Pseudoxanthoma elasticum: genetic diagnostic markers. Expert Opin Med Diagn. 2008;2:63–79. [PubMed: 23485117]
  • Scott RH, Douglas J, Baskcomb L, Huxter N, Barker K, Hanks S, Craft A, Gerrard M, Kohler JA, Levitt GA, Picton S, Pizer B, Ronghe MD, Williams D., Factors Associated with Childhood Tumours (FACT) Collaboration. Cook JA, Pujol P, Maher ER, Birch JM, Stiller CA, Pritchard-Jones K, Rahman N. Constitutional 11p15 abnormalities, including heritable imprinting center mutations, cause nonsyndromic Wilms tumor. Nat Genet. 2008;40:1329–34. [PubMed: 18836444]
  • Shuman C, Smith AC, Steele L, Ray PN, Clericuzio C, Zackai E, Parisi MA, Meadows AT, Kelly T, Tichauer D, Squire JA, Sadowski P, Weksberg R. Constitutional UPD for chromosome 11p15 in individuals with isolated hemihyperplasia is associated with high tumor risk and occurs following assisted reproductive technologies. Am J Med Genet A. 2006;140:1497–503. [PubMed: 16770802]
  • Sims D, Sudbery I, Ilott NE, Heger A, Ponting CP. Sequencing depth and coverage: key considerations in genomic analyses. Nat Rev Genet. 2014;15:121–32. [PubMed: 24434847]
  • Soellner L, Begemann M, Mackay DJ, Grønskov K, Tümer Z, Maher ER, Temple IK, Monk D, Riccio A, Linglart A, Netchine I, Eggermann T. Recent Advances in Imprinting Disorders. Clin Genet. 2017;91:3–13. [PubMed: 27363536]
  • Warr A, Robert C, Hume D, Archibald A, Deeb N, Watson M. Exome sequencing: current and future perspectives. G3 (Bethesda). 2015;5:1543–50. [PMC free article: PMC4528311] [PubMed: 26139844]

Revision History

  • 18 June 2020 (sw) Revision: Chromosomal microarray (CMA) added
  • 12 February 2018 (sw) Update: Genetic Testing: Current Approaches – introductory and genetics professional versions
  • 14 March 2017 (sw) Comprehensive genome testing and multigene panels

Figures

Figure 1.

Figure 1.

Oligo aCGH example of a heterozygous deletion and a heterozygous duplication

Segment of an oligo aCGH showing a plot of the ratio fluorescence intensity. A chromosome region with a heterozygous deletion shows several adjacent probes with decreased fluorescent intensity (-1) relative to the control sample. A chromosome region with a heterozygous duplication shows several adjacent probes with an increased fluorescent intensity (+1) relative to the control sample.

Figure 2.

Figure 2.

SNP array example of a heterozygous deletion and a heterozygous duplication

Each dot represents the B-allele frequency and total fluorescence intensity for a single SNP. Predicted genotypes of SNPs as measured by B-allele frequency are shown in red font. The lower-case letters (a-d) at the top and bottom of the diagram identify segments of an SNP array that demonstrate the B-allele frequency and intensity signals typical for: (a) a normal diploid region with identified genotypes for each SNP of AA, AB, or BB; (b) a heterozygous deletion in which the AB genotype is absent and only the genotypes B and A are identified at each SNP, and the decrease in intensity reflects the decreased number of alleles; (c) a normal diploid region; and (d) a heterozygous duplication with identified genotypes for each SNP of AAA, AAB, ABB, or BBB, and the increase in intensity reflects the greater number of alleles.

Figure 3.

Figure 3.

SNP array example of copy-neutral homozygosity

Each dot represents the B-allele frequency and total fluorescence intensity for a single SNP. Predicted genotypes of SNPs as measured by B-allele frequency are shown in red font. The lower case letters (a, b) below the diagram identify segments of an SNP array that demonstrate the B-allele frequency, and intensity signals that are typical for (a) a normal diploid region with identified genotypes for each SNP of AA, AB, or BB; and (b) a region of copy-neutral homozygosity that is diploid and, therefore, every SNP is homozygous (AA or BB) and intensity is unchanged.

Figure 4.

Figure 4.

SNP array example of mosaic deletion

Each dot represents the B-allele frequency and total fluorescence intensity for a single SNP. Predicted genotypes of SNPs as measured by B-allele frequency are shown in red font. The lower-case letters (a, b) below the diagram identify segments of an SNP array that demonstrate the B-allele frequency and intensity signals typical for (a) a normal diploid region with identified genotypes for each SNP of AA, AB, or BB; and (b) a mosaic deletion with identified genotypes for each SNP of AA, AB, or BB. The decrease in intensity is less than the decreased intensity identified in a nonmosaic deletion. The percentage of cells mosaic for a deletion can be determined based on the B-allele frequency and decrease in intensity.

Copyright © 1993-2024, University of Washington, Seattle. GeneReviews is a registered trademark of the University of Washington, Seattle. All rights reserved.

GeneReviews® chapters are owned by the University of Washington. Permission is hereby granted to reproduce, distribute, and translate copies of content materials for noncommercial research purposes only, provided that (i) credit for source (http://www.genereviews.org/) and copyright (© 1993-2024 University of Washington) are included with each copy; (ii) a link to the original material is provided whenever the material is published elsewhere on the Web; and (iii) reproducers, distributors, and/or translators comply with the GeneReviews® Copyright Notice and Usage Disclaimer. No further modifications are allowed. For clarity, excerpts of GeneReviews chapters for use in lab reports and clinic notes are a permitted use.

For more information, see the GeneReviews® Copyright Notice and Usage Disclaimer.

For questions regarding permissions or whether a specified use is allowed, contact: ude.wu@tssamda.
Bookshelf ID: NBK279899